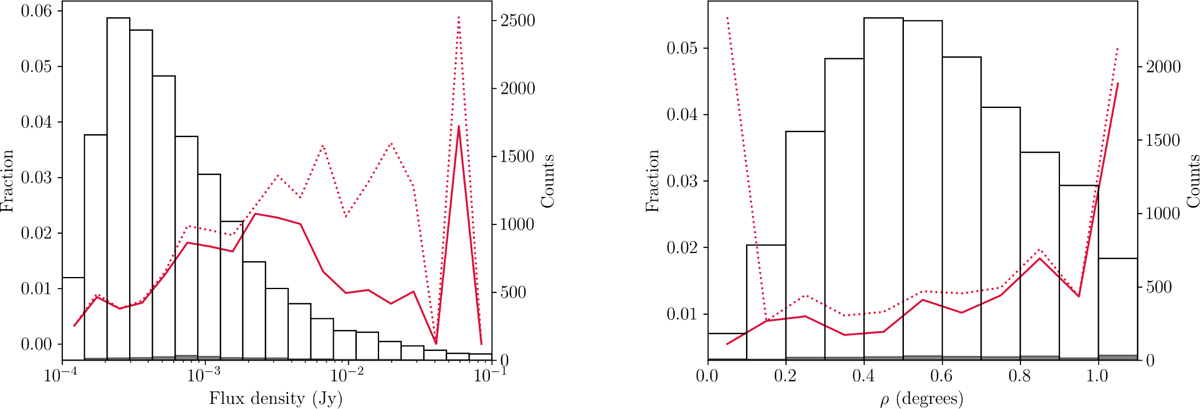
Fig. 18
Download original image
Purity of catalogues as a function flux density (left) and separation from the pointing centre (right). The fraction of false detections is indicated by the red line, both the total fraction (dotted line) and with removal of sidelobes (solid line). The open histograms show the number of sources detected in the pointings, with the filled histograms indicating the number of false detections. Though there seems to be no strong relation between flux density and purity, the number of false detections is strongly dependent on distance from the pointing centre, increasing both towards the centre and towards the edges of the pointing. Our criterion for identifying artefacts flags most of the false detections around the central source.
Current usage metrics show cumulative count of Article Views (full-text article views including HTML views, PDF and ePub downloads, according to the available data) and Abstracts Views on Vision4Press platform.
Data correspond to usage on the plateform after 2015. The current usage metrics is available 48-96 hours after online publication and is updated daily on week days.
Initial download of the metrics may take a while.