Fig. 21
Download original image
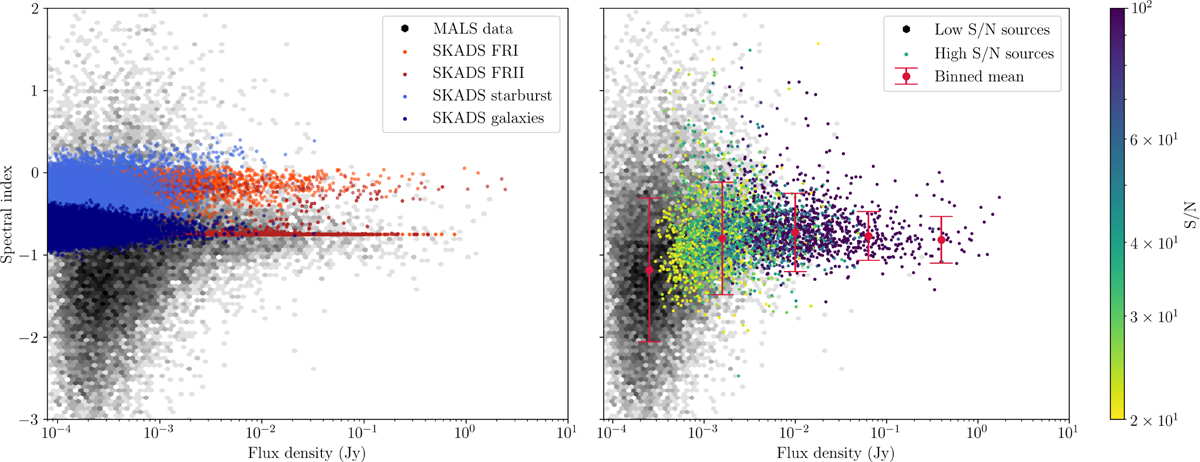
Distribution of spectral indices of MALS sources. Left: MALS spectral indices (black) compared to AGN (red) and star-forming galaxies (blue) from SKADS as a function of flux density. Right: MALS spectral indices as a function of flux density, sources with S/N above 20 are coloured by S/N. The median value and error of spectral indices of different flux bins are indicated by red error bars, indicating that at lower flux densities spectral indices tend towards lower values.
Current usage metrics show cumulative count of Article Views (full-text article views including HTML views, PDF and ePub downloads, according to the available data) and Abstracts Views on Vision4Press platform.
Data correspond to usage on the plateform after 2015. The current usage metrics is available 48-96 hours after online publication and is updated daily on week days.
Initial download of the metrics may take a while.