Fig. 23
Download original image
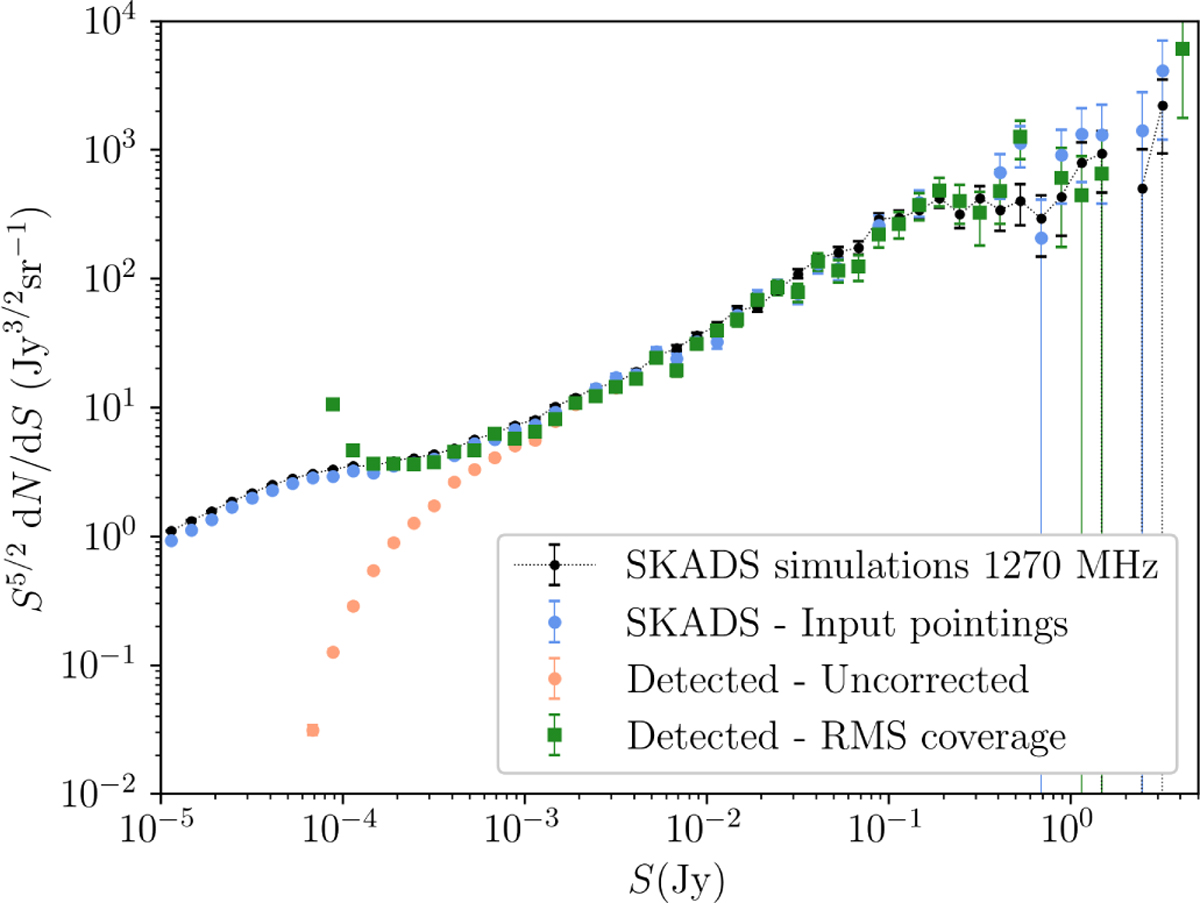
Differential source counts from the SKADS simulations. The complete SKADS sample is shown (black), as well as the sample extracted from SKADS and injected into the images (blue). The uncorrected number counts (beige) indicate the sources detected by the source finding routine, which are then corrected with the RMS noise coverage (green).
Current usage metrics show cumulative count of Article Views (full-text article views including HTML views, PDF and ePub downloads, according to the available data) and Abstracts Views on Vision4Press platform.
Data correspond to usage on the plateform after 2015. The current usage metrics is available 48-96 hours after online publication and is updated daily on week days.
Initial download of the metrics may take a while.