Fig. 24
Download original image
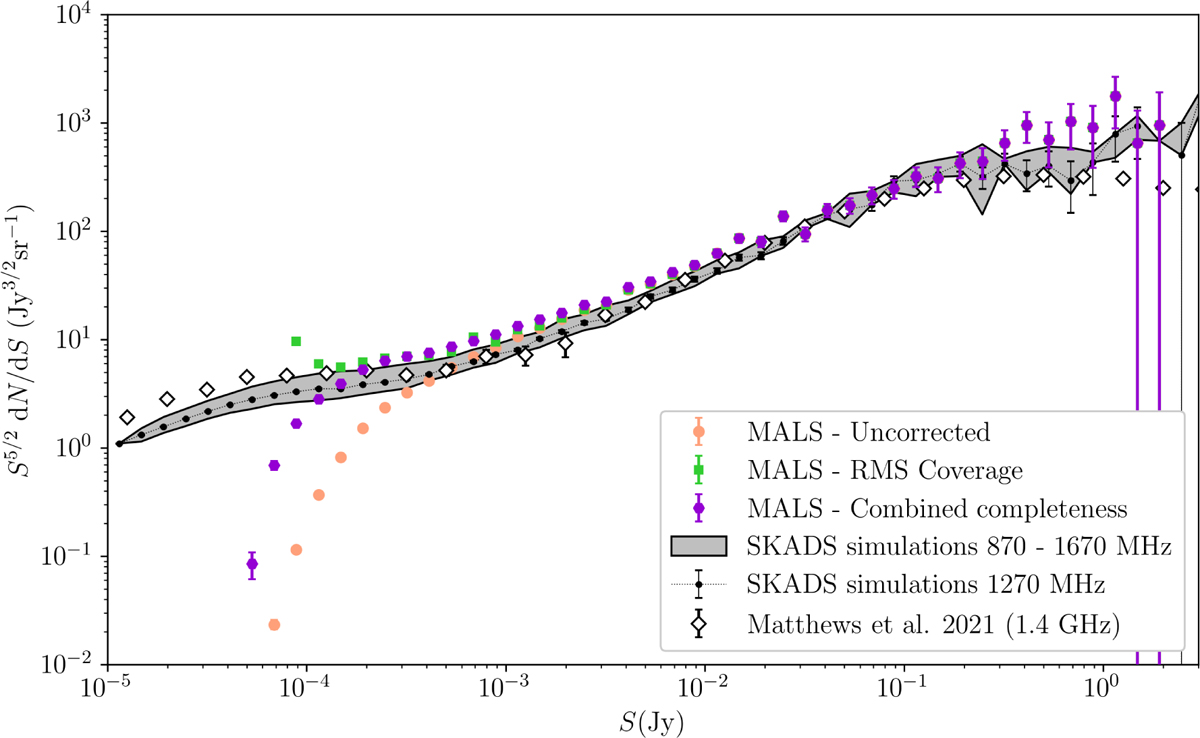
Differential source counts from MALS, uncorrected (beige circles) and corrected with completeness (purple hexagons) taking into account whether a source is resolved or unresolved. Lastly, source counts are also corrected with RMS noise coverage (green squares), which for the lowest flux bins goes to zero, causing solutions to diverge. This is all compared to the SKADS source counts, both for the central frequency of 1270 MHz (black), and for the full frequency range (grey area), and to the source counts derived from the MeerKAT DEEP2 image and NVSS from Matthews et al. (2021, white diamonds). The number counts are tabulated in Table 3.
Current usage metrics show cumulative count of Article Views (full-text article views including HTML views, PDF and ePub downloads, according to the available data) and Abstracts Views on Vision4Press platform.
Data correspond to usage on the plateform after 2015. The current usage metrics is available 48-96 hours after online publication and is updated daily on week days.
Initial download of the metrics may take a while.