Fig. A.1
Download original image
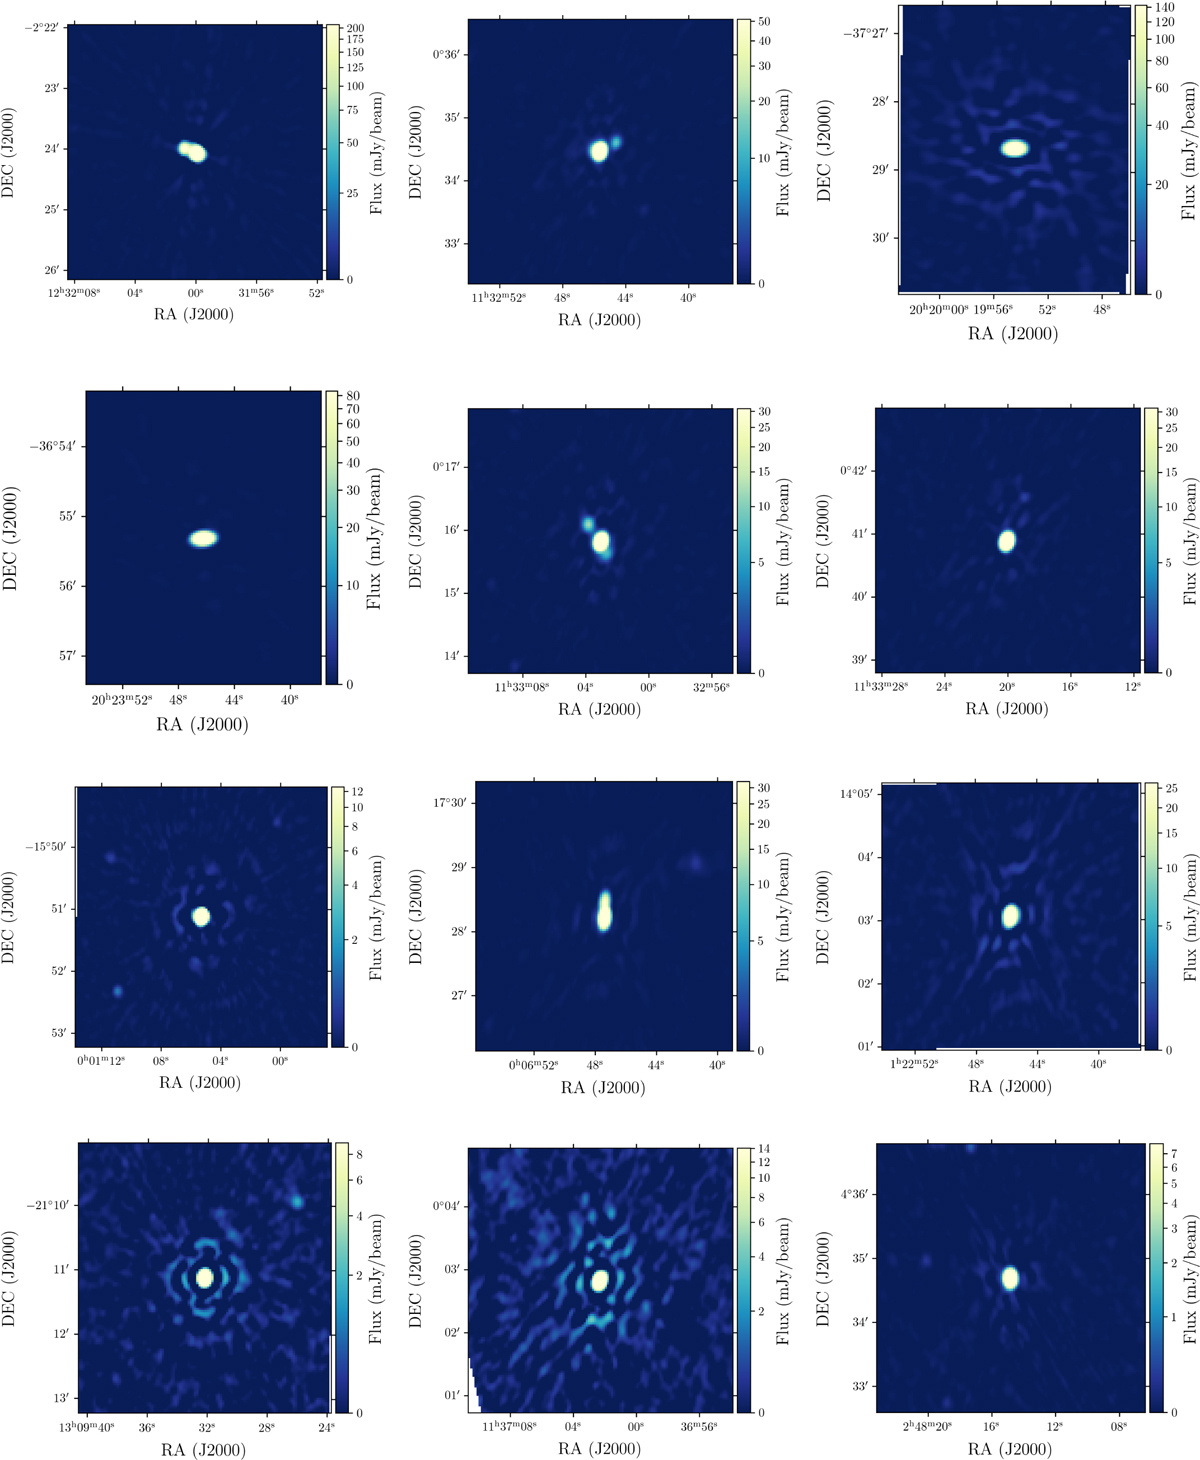
Selection of brightest sources in the combined catalogue with α >= −0.5. As discussed in Sect. 5.2, this range of spectral indices is expected to come from emission originating in AGN cores, which are generally point sources. The majority of this sample indeed is unresolved or can be seen to dominate the emission from their associated lobes.
Current usage metrics show cumulative count of Article Views (full-text article views including HTML views, PDF and ePub downloads, according to the available data) and Abstracts Views on Vision4Press platform.
Data correspond to usage on the plateform after 2015. The current usage metrics is available 48-96 hours after online publication and is updated daily on week days.
Initial download of the metrics may take a while.