Open Access
Fig. 9.
Download original image
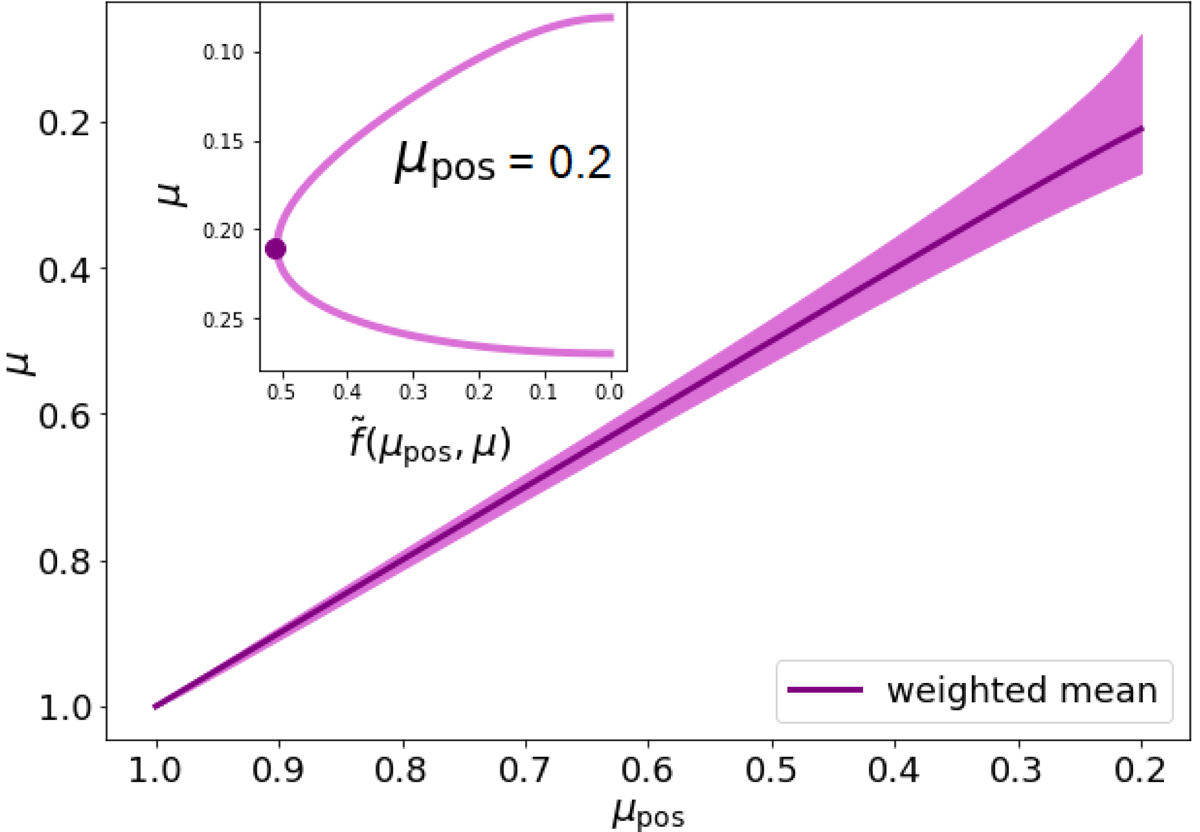
Contribution of μ radii contained at respective μpos observation radii. The broad band shows the total distribution of μ, the darker line the weighted mean of a specific radius. The cross-section inset shows the weighted flux distribution ![]() for μpos = 0.2, where the weighted mean is marked by a dot.
for μpos = 0.2, where the weighted mean is marked by a dot.
Current usage metrics show cumulative count of Article Views (full-text article views including HTML views, PDF and ePub downloads, according to the available data) and Abstracts Views on Vision4Press platform.
Data correspond to usage on the plateform after 2015. The current usage metrics is available 48-96 hours after online publication and is updated daily on week days.
Initial download of the metrics may take a while.