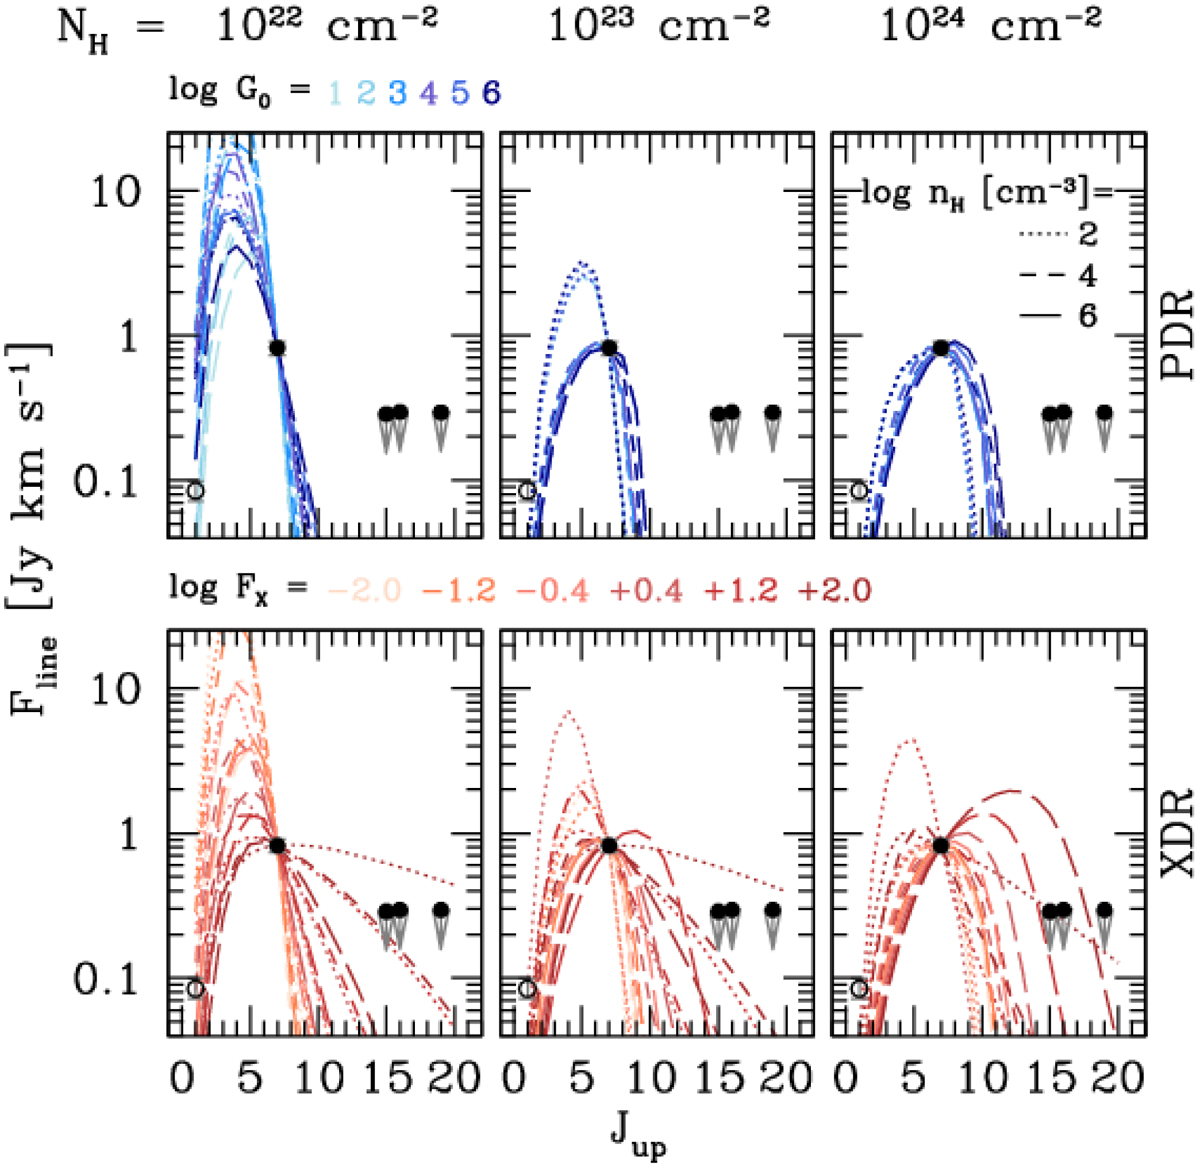
Fig. 9.
Download original image
Observed constraints on the CO spectral line energy distribution in PJ183+05. Our measurements are shown as black filled circles. Top and bottom panels show the models for PDRs and XDRs, respectively. We mark models, taken from Pensabene et al. (2021), with increasingly darker colors at increasing intensity of the radiation field. Dotted, short-dashed, and long-dashed lines refer to models with gas density log n [cm−3] = 2, 4, 6 respectively. All models are normalized to the observed CO(7–6) line flux. We plot the observed line fluxes or upper limits as black circles. In addition, we show the predicted CO(1–0) flux, as derived from the dust continuum, as described in Sect. 4.5. Our constraints exclude a strong XDR environment, but leave room for a combination of PDR and XDR environments in the excitation conditions of the molecular ISM in PJ183+05.
Current usage metrics show cumulative count of Article Views (full-text article views including HTML views, PDF and ePub downloads, according to the available data) and Abstracts Views on Vision4Press platform.
Data correspond to usage on the plateform after 2015. The current usage metrics is available 48-96 hours after online publication and is updated daily on week days.
Initial download of the metrics may take a while.