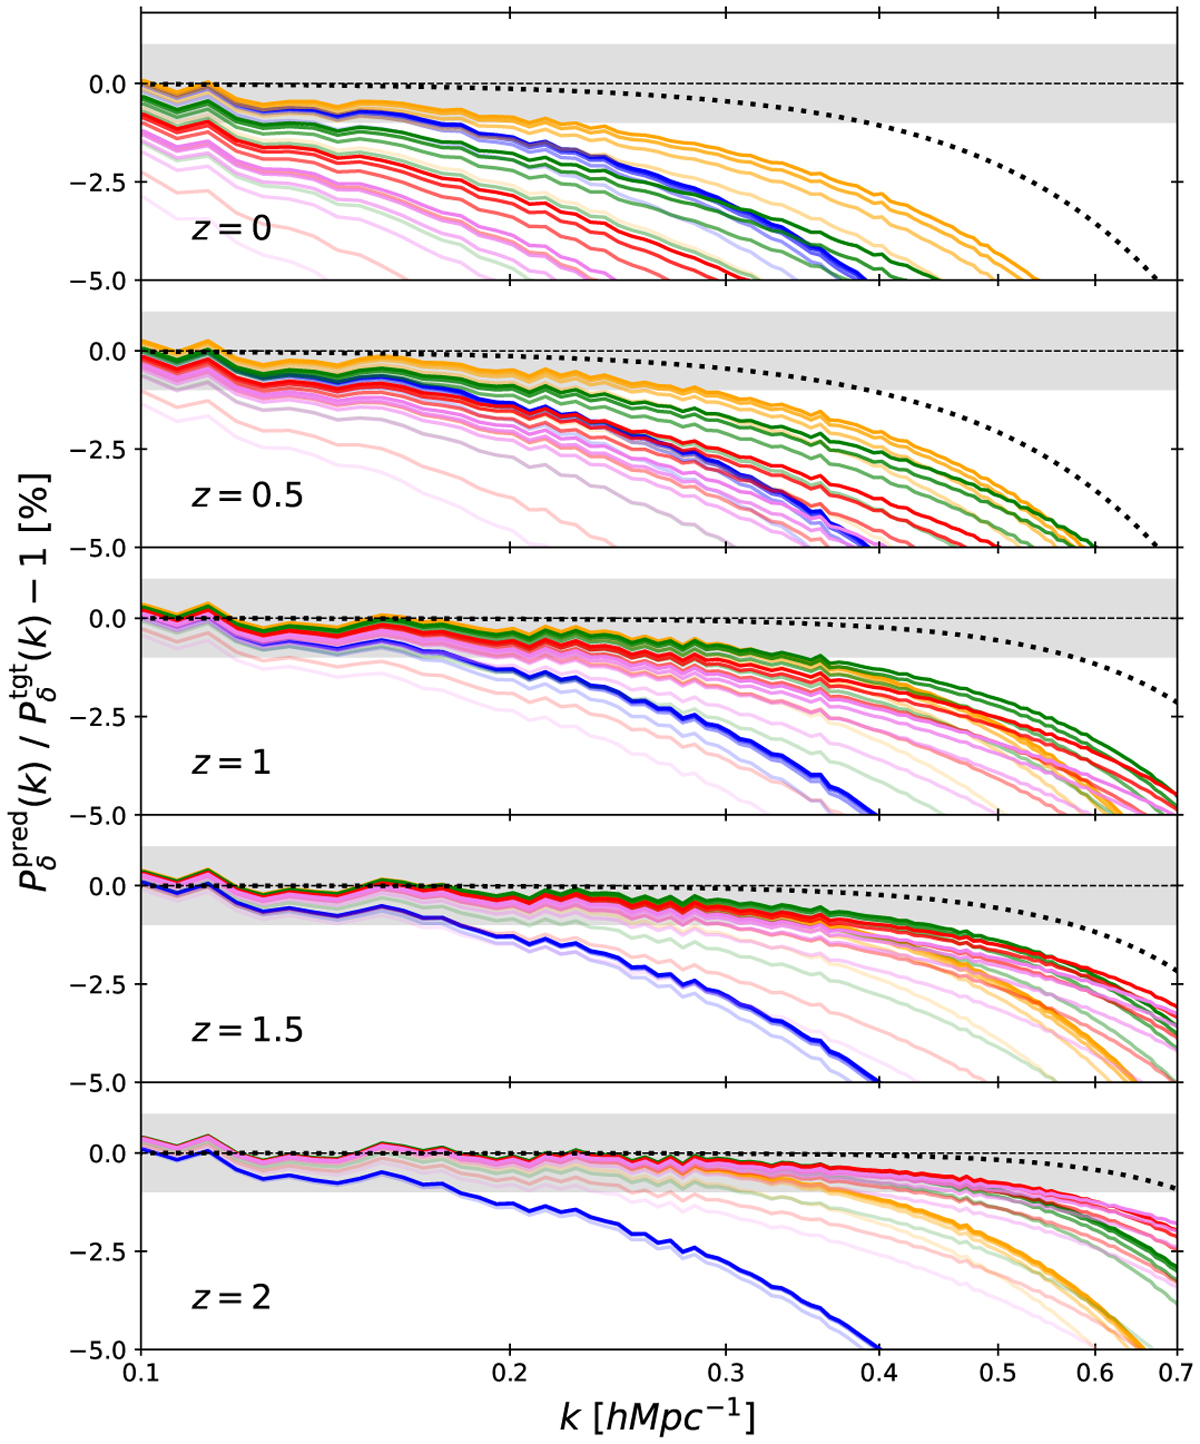
Fig. 1.
Download original image
Relative deviation between the predicted grid power spectrum (after the two filterings Eq. (6) and (7)) and the corresponding target power spectrum for all five selected redshifts in the ΛCDM cosmology (similar results are obtained for the massive neutrinos, 16nu cosmology). The predicted spectra are computed for all combinations of parameters i = [2, 3, 4, 5, 6] and j = [2, 4, 6, 8, 10]. Each colour represents a certain value of i, respectively blue, orange, green, red, and violet. An increasing colour intensity means an increasing j value. The dotted black line is the relative deviation when only the first filter, Eq. (6), is applied, taking the identified optimal i, respectively 3, 3, 4, 4, and 5. The grey area delimits the 1% limit.
Current usage metrics show cumulative count of Article Views (full-text article views including HTML views, PDF and ePub downloads, according to the available data) and Abstracts Views on Vision4Press platform.
Data correspond to usage on the plateform after 2015. The current usage metrics is available 48-96 hours after online publication and is updated daily on week days.
Initial download of the metrics may take a while.