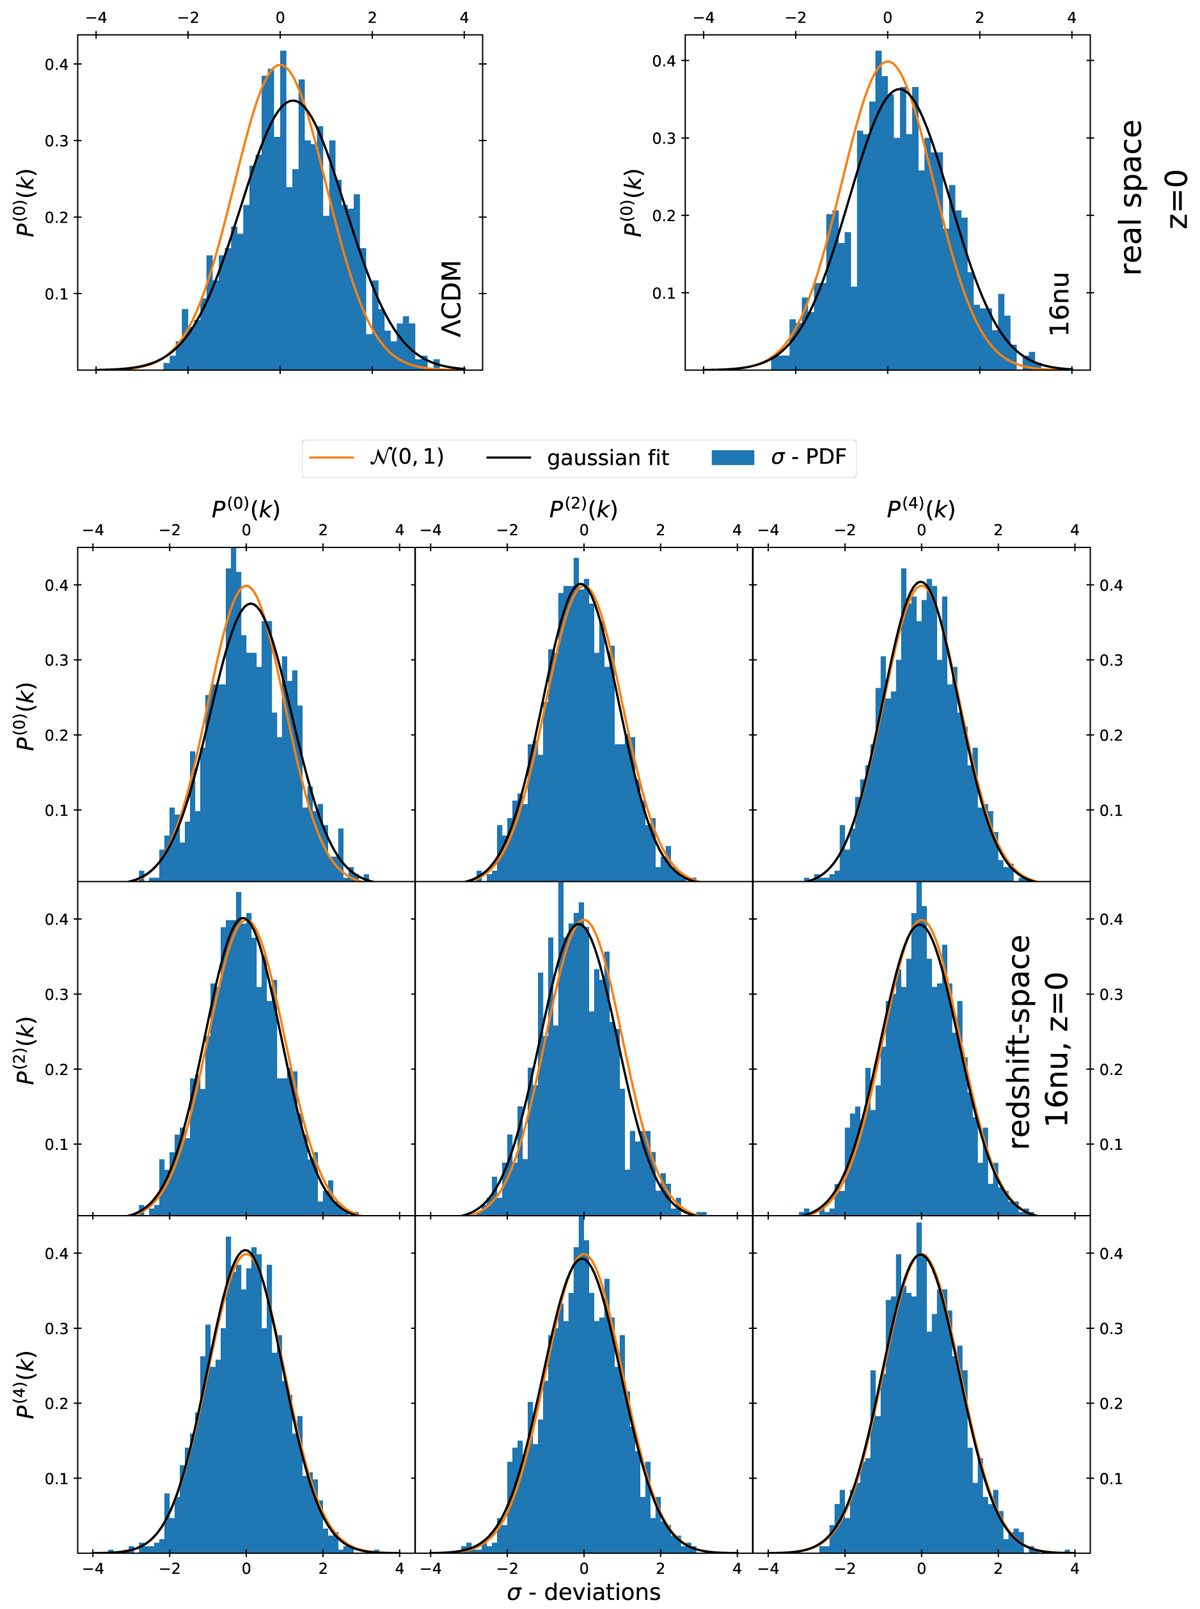
Fig. 14.
Download original image
Normalised distributions of the residual of the covariance matrices normalised by Gaussian error (the σ-deviation distribution, see Fig. 11) for the multipoles of the power spectrum at z = 0 in blue. Its Gaussian fit (on the two first moments) is represented in black and is compared to the standardised normal distribution in orange. Upper panels presents the distributions in real space for the two cosmologies, while the bottom panels give the results in the redshift space, for the 16nu cosmology only. In these panels, the maximal Fourier mode is set to kmax = 0.25h Mpc−1.
Current usage metrics show cumulative count of Article Views (full-text article views including HTML views, PDF and ePub downloads, according to the available data) and Abstracts Views on Vision4Press platform.
Data correspond to usage on the plateform after 2015. The current usage metrics is available 48-96 hours after online publication and is updated daily on week days.
Initial download of the metrics may take a while.