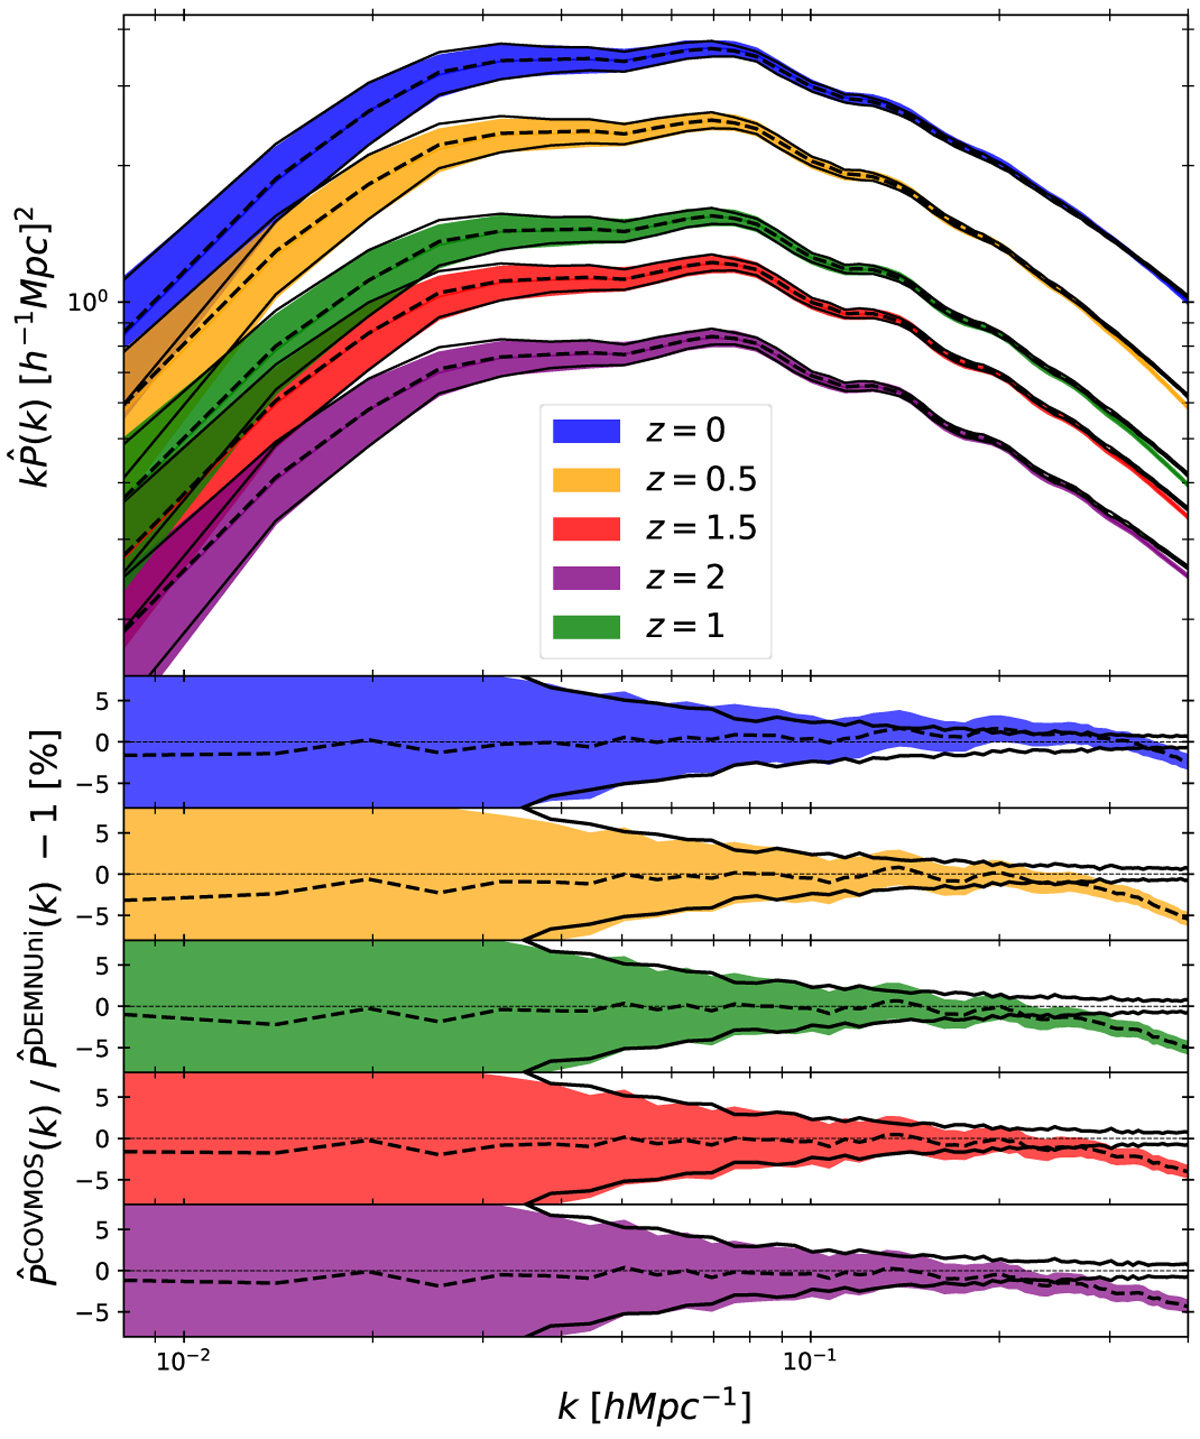
Fig. 6.
Download original image
Redshift-space power spectrum comparison between the COVMOS and the DEMNUni_cov experiments. Top panel: average of the estimated redshift-space power spectrum monopoles over 5000 realisations of COVMOS catalogues in the 16nu cosmology. The dispersion on each realisation is represented by the shaded area. The same quantities are represented in black for the 50 DEMNUni_cov realisations. Bottom panels: relative deviation between the averaged COVMOS and DEMNUni_cov outputs in dashed black lines with error bars following the same colour-coding.
Current usage metrics show cumulative count of Article Views (full-text article views including HTML views, PDF and ePub downloads, according to the available data) and Abstracts Views on Vision4Press platform.
Data correspond to usage on the plateform after 2015. The current usage metrics is available 48-96 hours after online publication and is updated daily on week days.
Initial download of the metrics may take a while.