Fig. 7.
Download original image
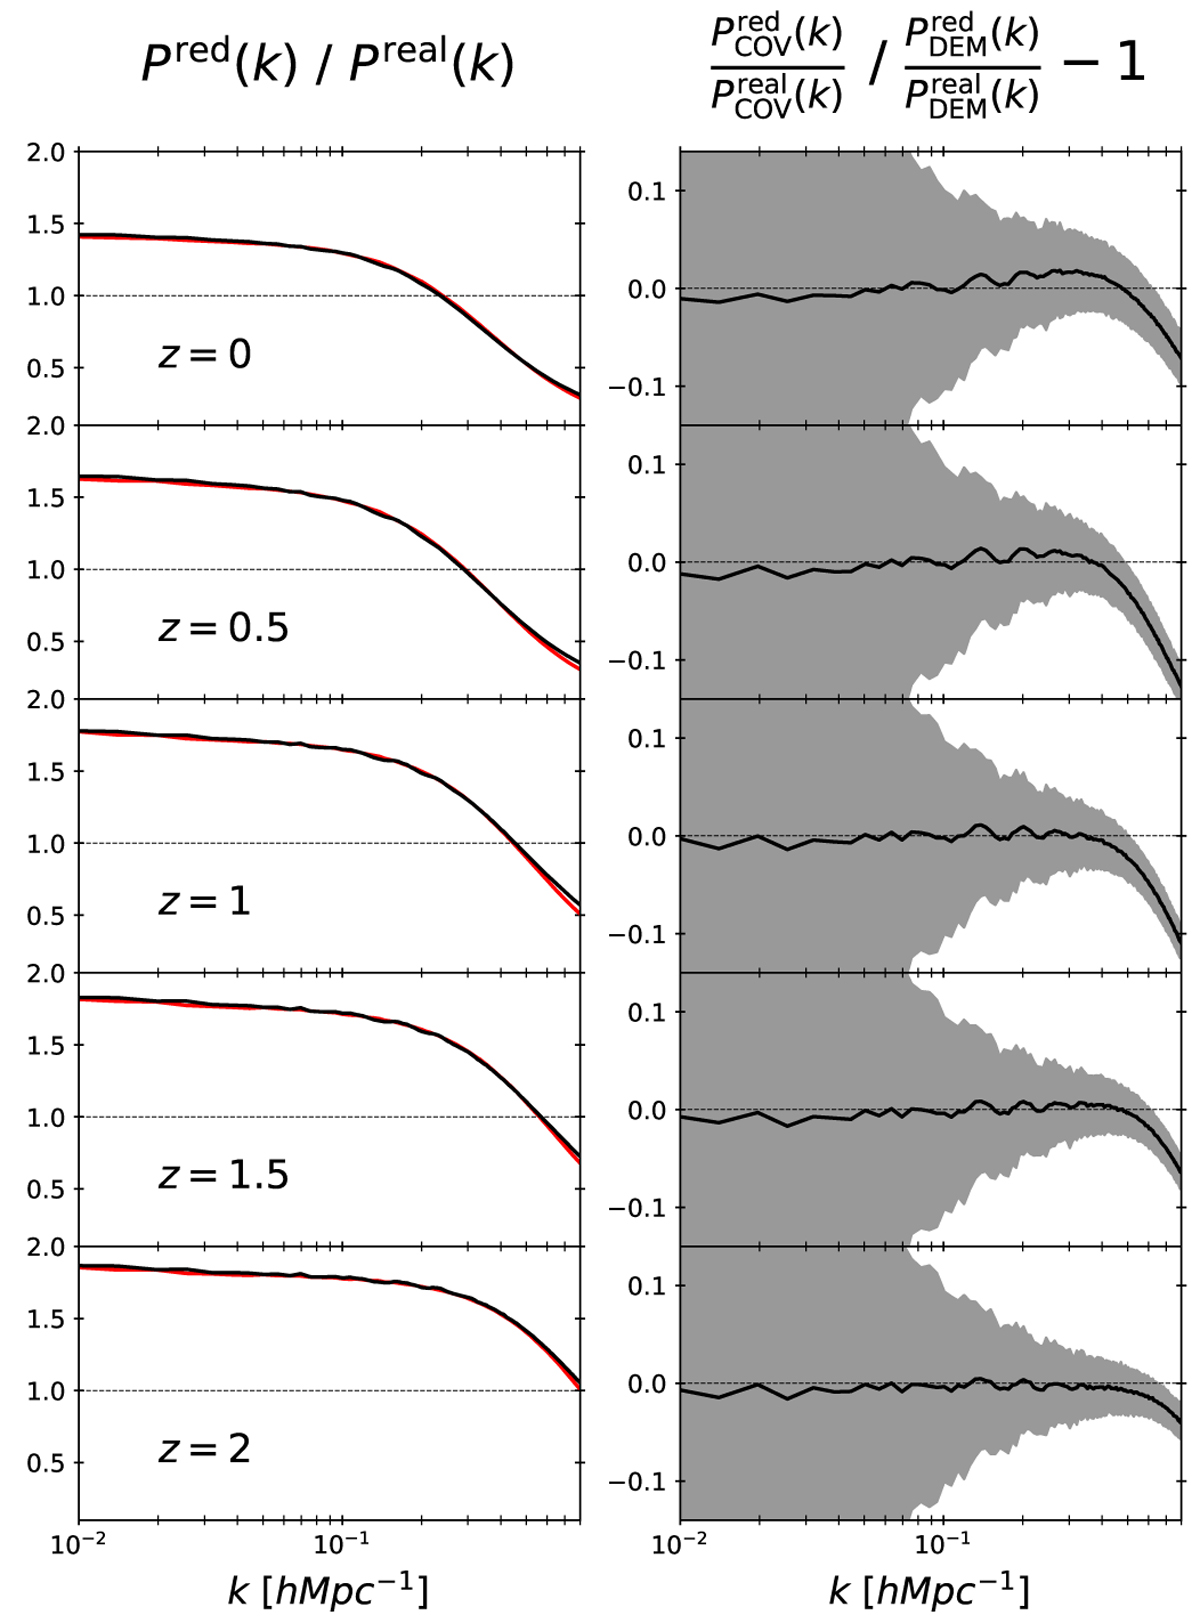
Comparison of the redshift-space to real space power spectrum monopoles ratio between the COVMOS and DEMNUni_cov experiments. Left: ratio between averaged monopoles with and without RSD contribution in black for DEMNUni_cov and in red for COVMOS, for the five different redshifts. Right: Ratio between the previous quantities in black solid line with error bars in shaded grey, jointly accounting for estimated variance on DEMNUni_cov and COVMOS in both real and redshift-space.
Current usage metrics show cumulative count of Article Views (full-text article views including HTML views, PDF and ePub downloads, according to the available data) and Abstracts Views on Vision4Press platform.
Data correspond to usage on the plateform after 2015. The current usage metrics is available 48-96 hours after online publication and is updated daily on week days.
Initial download of the metrics may take a while.