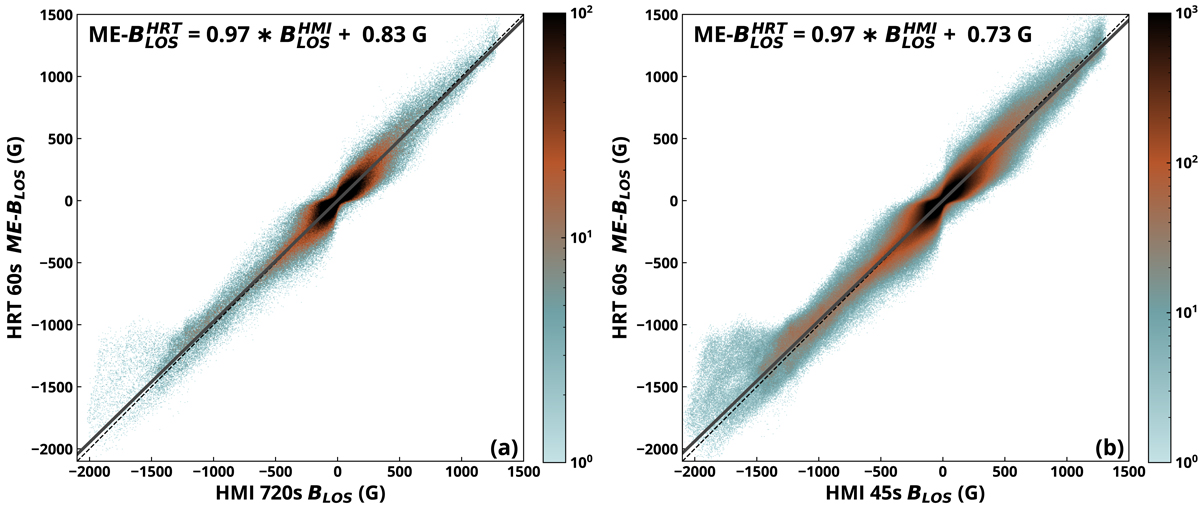
Fig. 2.
Download original image
Scatter plot comparing pairs of SO/PHI-HRT 60-second ME-BLOS and HMI BLOS. The log density of the pixels is shown and saturated at 100 (a) and 1000 (b) pixels per plotted point for clarity. The averaged linear fit (of HMI vs. SO/PHI-HRT and SO/PHI-HRT vs. HMI) is shown with the solid grey line, and a one-to-one correspondence is indicated by the dashed black line. Panel a: seven pairs with HMI 720-second magnetograms. Panel b: 56 pairs with HMI 45-second magnetograms. See the main text for a more detailed description.
Current usage metrics show cumulative count of Article Views (full-text article views including HTML views, PDF and ePub downloads, according to the available data) and Abstracts Views on Vision4Press platform.
Data correspond to usage on the plateform after 2015. The current usage metrics is available 48-96 hours after online publication and is updated daily on week days.
Initial download of the metrics may take a while.