Fig. 3.
Download original image
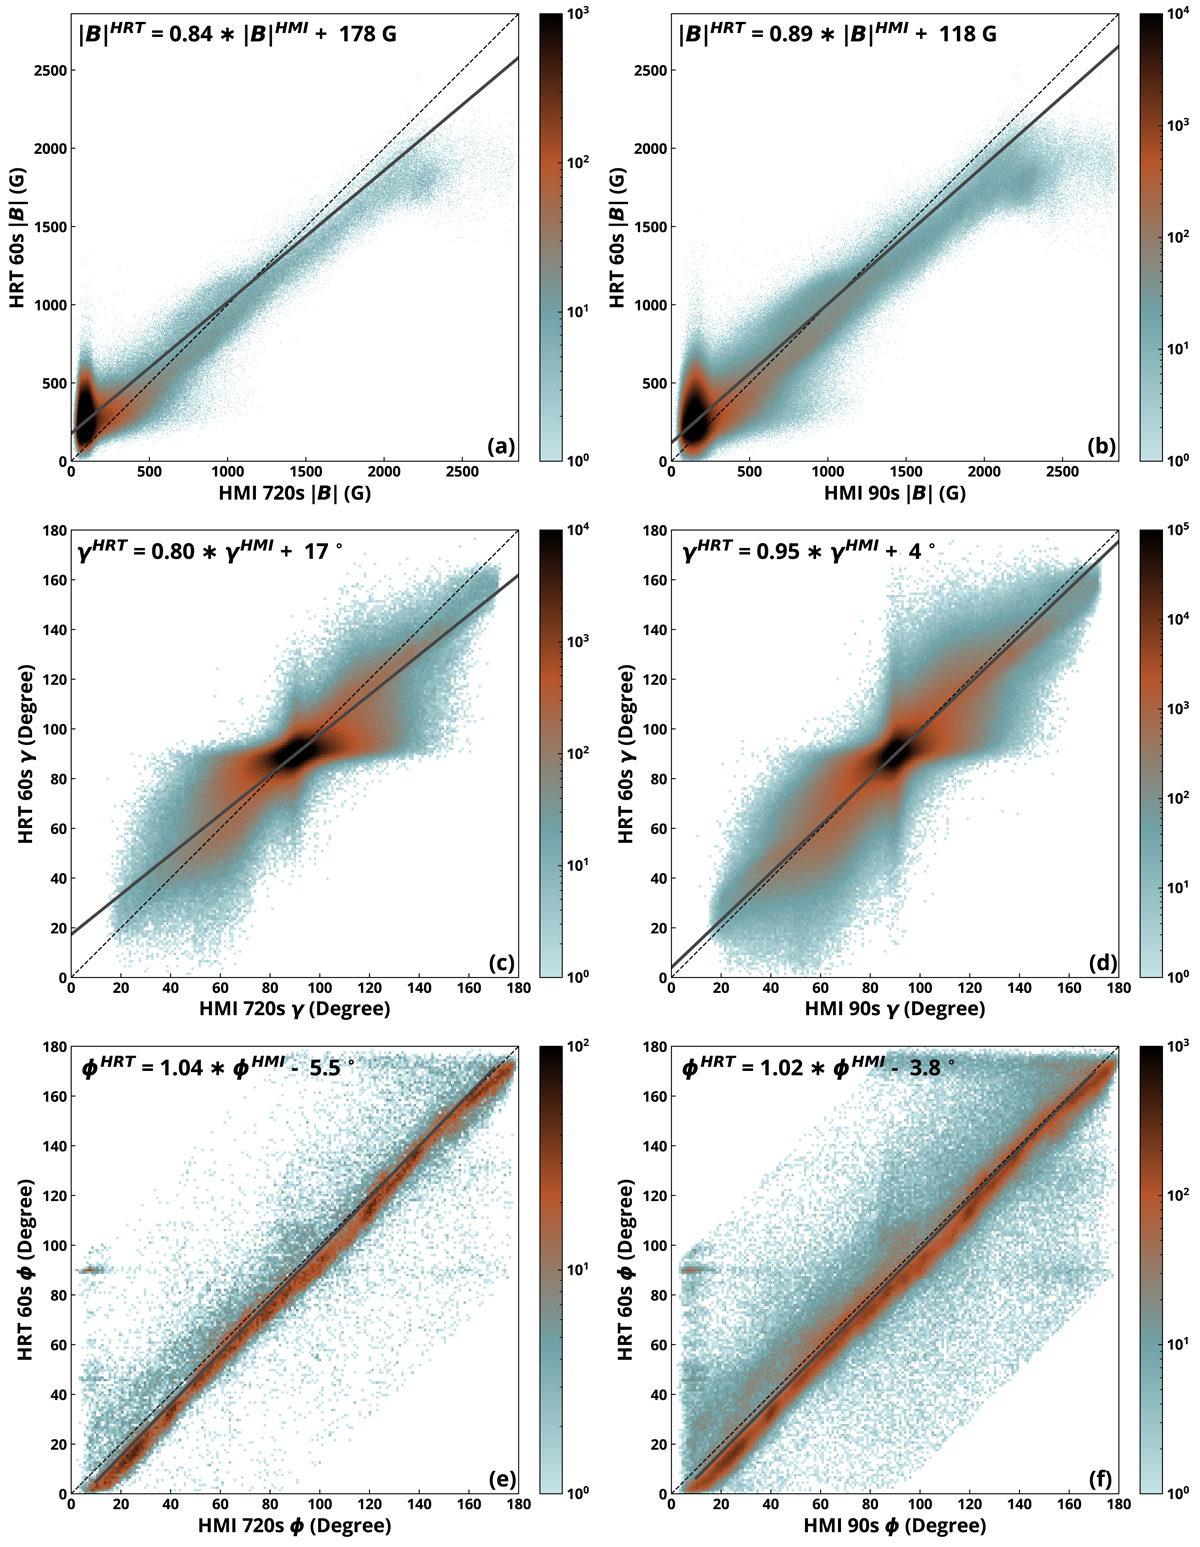
Scatter plots comparing SO/PHI-HRT and HMI vector magnetic field maps. The first column compares inversion results from seven pairs of SO/PHI-HRT 60-second and HMI 720-second datasets, while the second column does the same for 38 pairs of SO/PHI-HRT 60-second and HMI 90-second datasets. The log density of the pixels is given by the colour scale and is saturated for clarity. The averaged linear fit and y = x are given by the solid grey and dashed black lines, respectively. Panels a and b: magnetic field strength. Panels c and d: magnetic field inclination (relative to the LoS). Panels e and f: magnetic field azimuth. Pixels where |ϕHMI − ϕHRT|> 90° and |B|HRT < 600 G are omitted and not included in the fit.
Current usage metrics show cumulative count of Article Views (full-text article views including HTML views, PDF and ePub downloads, according to the available data) and Abstracts Views on Vision4Press platform.
Data correspond to usage on the plateform after 2015. The current usage metrics is available 48-96 hours after online publication and is updated daily on week days.
Initial download of the metrics may take a while.