Fig. 3
Download original image
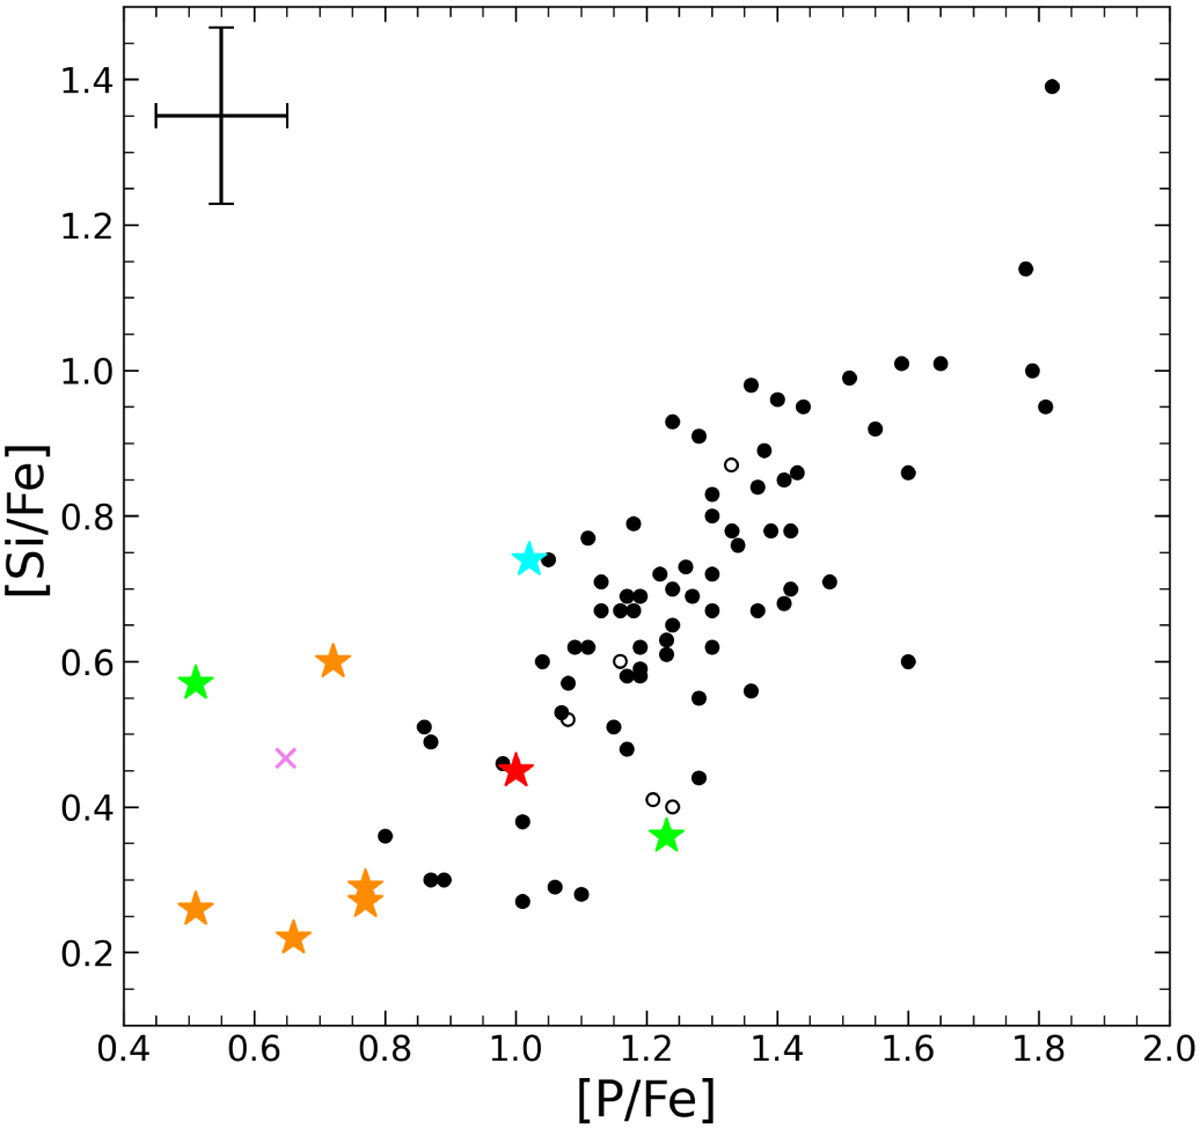
Abundances in the [Si/Fe] vs. [P/Fe] plane. The symbols are the same as in Fig. 2. The error bar represents the typical standard deviation of the elements listed in Table D.2. No background stars are displayed because the reliability of the P abundances obtained by the automatic calculation is limited (see Appendix C for further justifications).
Current usage metrics show cumulative count of Article Views (full-text article views including HTML views, PDF and ePub downloads, according to the available data) and Abstracts Views on Vision4Press platform.
Data correspond to usage on the plateform after 2015. The current usage metrics is available 48-96 hours after online publication and is updated daily on week days.
Initial download of the metrics may take a while.