Open Access
Fig. E.2.
Download original image
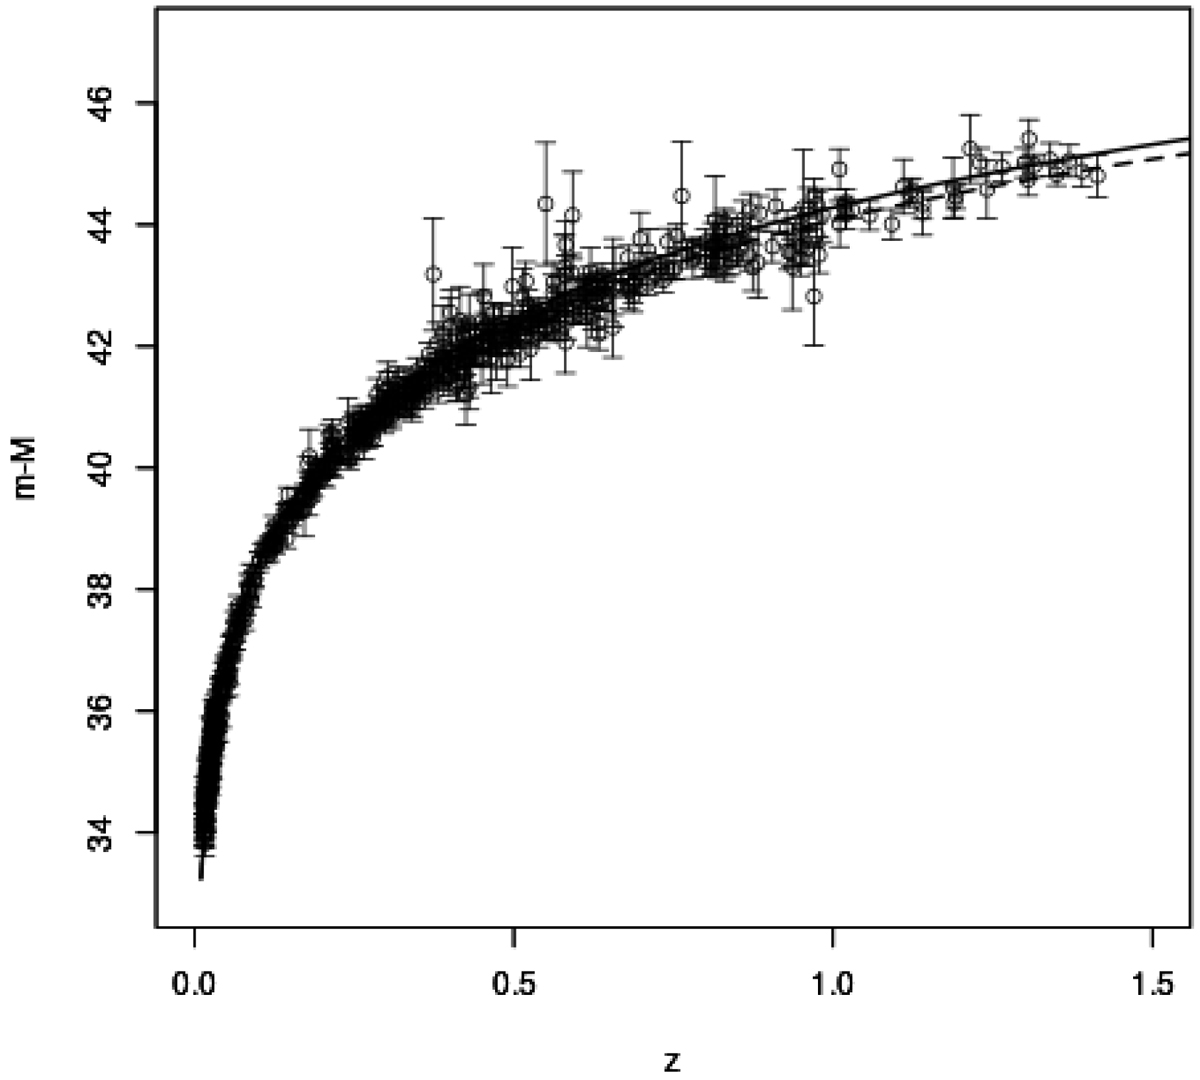
Hubble diagram of the SNIa data (open circles with error bars) and the CRG+ (solid line) and CRG– (dashed line) solutions. For the two curves, we adopt H0 = 67.7 km s−1 Mpc−1, Ω0 = 0.31, and ΩΞ0 = 0.65.
Current usage metrics show cumulative count of Article Views (full-text article views including HTML views, PDF and ePub downloads, according to the available data) and Abstracts Views on Vision4Press platform.
Data correspond to usage on the plateform after 2015. The current usage metrics is available 48-96 hours after online publication and is updated daily on week days.
Initial download of the metrics may take a while.