Open Access
Fig. 7.
Download original image
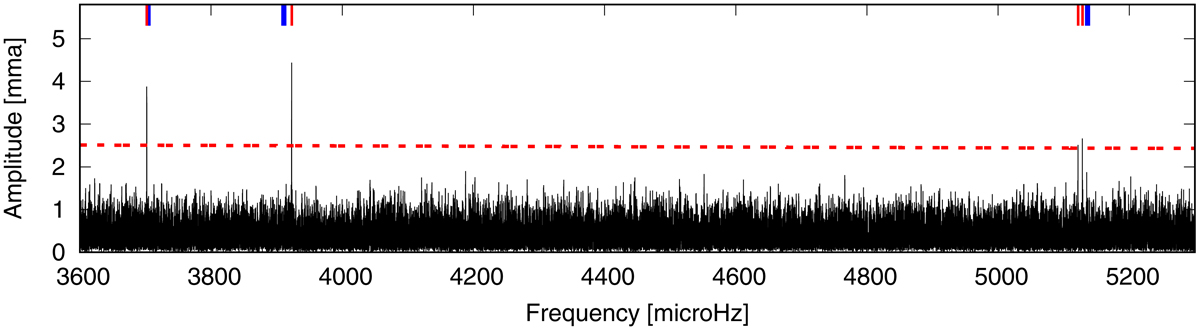
HS 1013+0321: Fourier transform of the ultrashort-cadence mode TESS observations. Red marks show the significant frequencies identified in these data, while blue marks show the location of pulsation components measured by Mukadam et al. (2004).
Current usage metrics show cumulative count of Article Views (full-text article views including HTML views, PDF and ePub downloads, according to the available data) and Abstracts Views on Vision4Press platform.
Data correspond to usage on the plateform after 2015. The current usage metrics is available 48-96 hours after online publication and is updated daily on week days.
Initial download of the metrics may take a while.