Fig. 10
Download original image
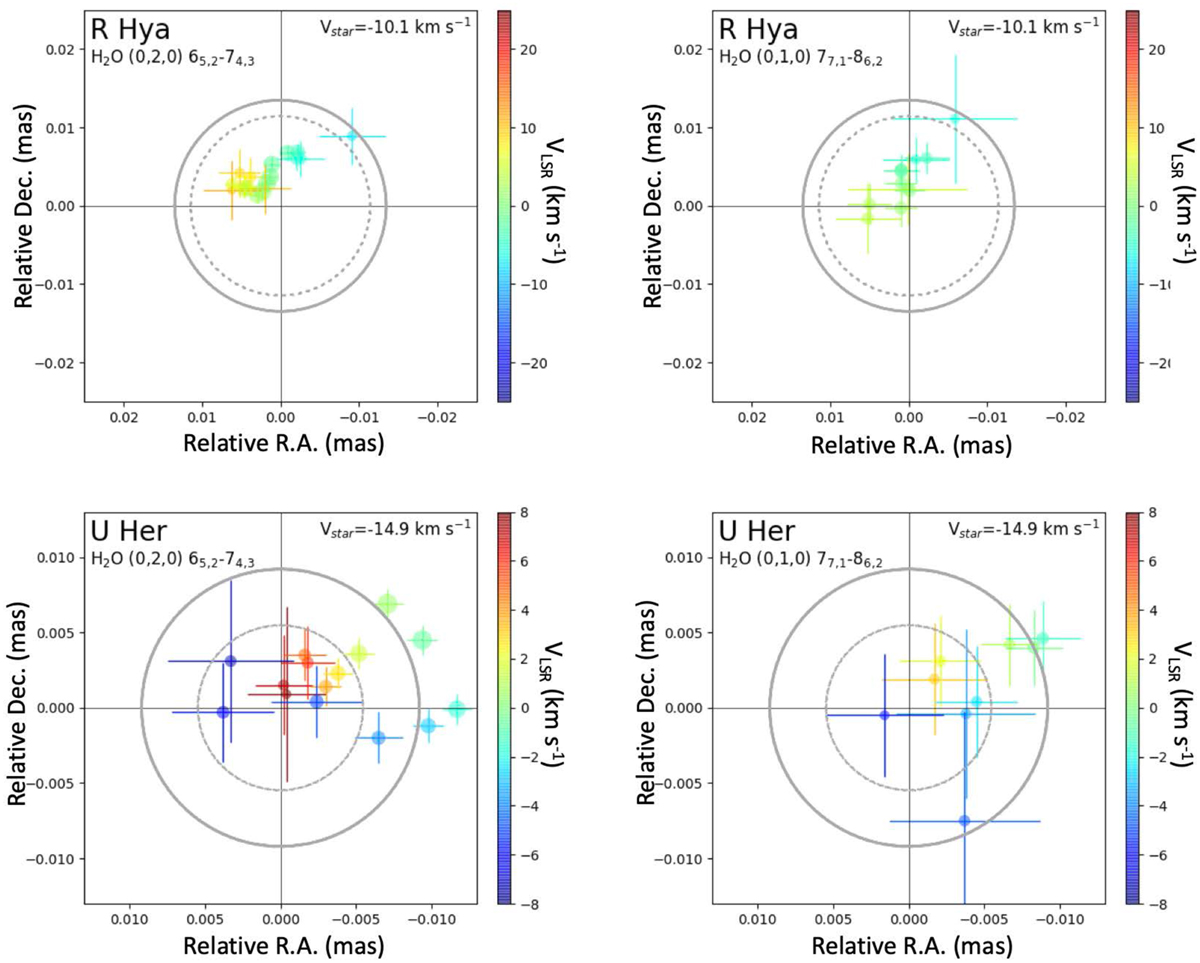
Maps of the different velocity components of water identified in the Gaussian-fit procedure at 268.149 and 262.898 GHz toward R Hya and UHer for the extended configuration of the main array. The size of the colored symbols varies as the square root of the integrated flux density of the Gaussian component; the crosses show the position uncertainty for each component The velocity scale colors are given on the right side of each map with respect to the stellar system velocity taken to be −10.1 and −14.9 km s−1 in the LSR frame for R Hya and U Her, respectively. The dashed gray circle represents the size of the optical photosphere (23.7 and 11.2 mas for R Hya and U Her, respectively) and the larger gray circle represents the 250 GHz continuum emission size (27.1 and 188.5 mat for RHya and U Her).
Current usage metrics show cumulative count of Article Views (full-text article views including HTML views, PDF and ePub downloads, according to the available data) and Abstracts Views on Vision4Press platform.
Data correspond to usage on the plateform after 2015. The current usage metrics is available 48-96 hours after online publication and is updated daily on week days.
Initial download of the metrics may take a while.