Fig. 11
Download original image
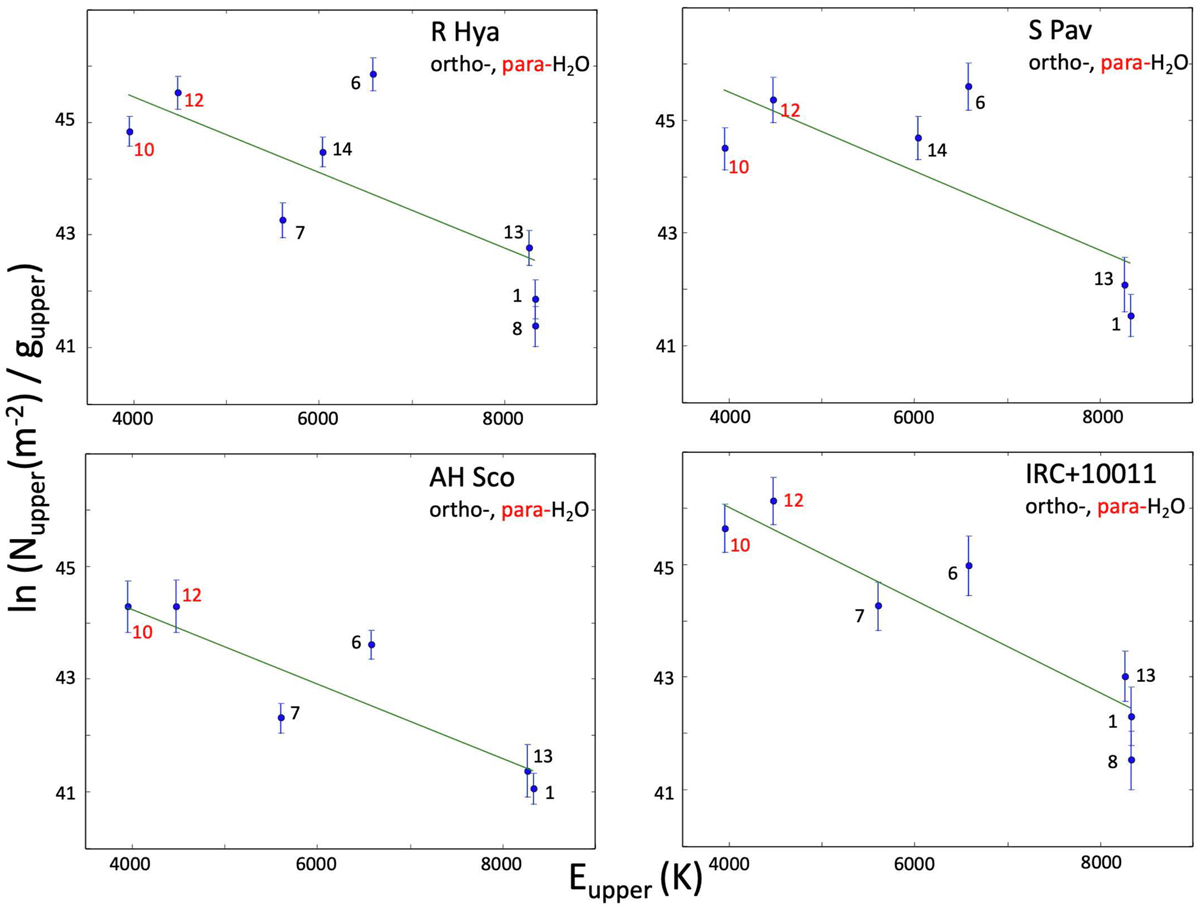
Population diagrams for ortho and para H2O transitions (black and red numbers, respectively) in R Hya, S Pav, AH Sco and IRC+10011. The number near each data point corresponds to the numbering used to identify each line in Table 2. The vertical bar in each data point includes the ±1σ formal error of the integrated flux density and a rough estimate of the filling factor uncertainty. The green line is the regression line across the data points from which the rotationaf temperature and the column density are derived (see Sect. 5.2). The strong 268.149 GHz maser line (line 14) is excluded from the IRC+10011 and AH Sco plots while it is kept in R Hya and S Pav.
Current usage metrics show cumulative count of Article Views (full-text article views including HTML views, PDF and ePub downloads, according to the available data) and Abstracts Views on Vision4Press platform.
Data correspond to usage on the plateform after 2015. The current usage metrics is available 48-96 hours after online publication and is updated daily on week days.
Initial download of the metrics may take a while.