Fig. 14
Download original image
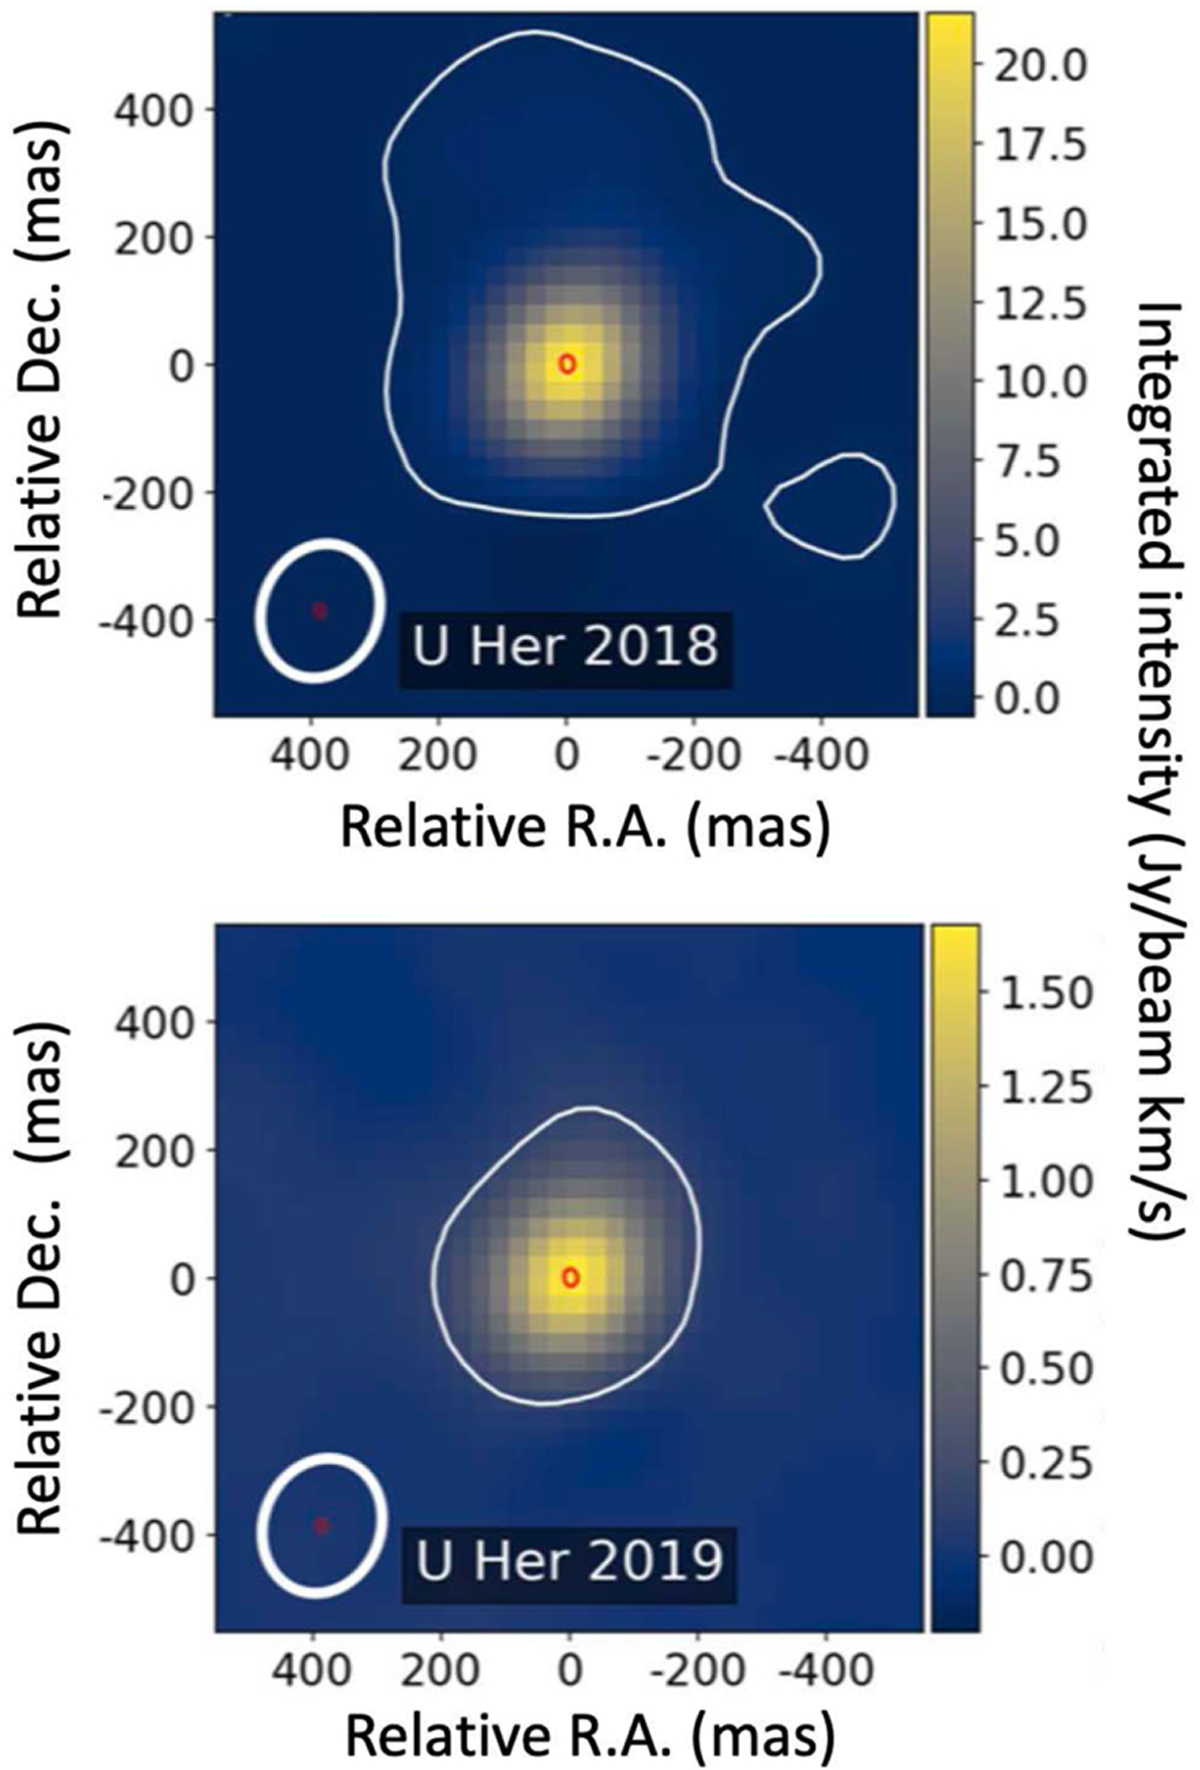
Zeroth moment maps of the 268.149 GHz emission of water in U Her obtained with the mid configuration of the main array at two different epochs, 2018, Oct. 14 and 2019, Aug. 24. The emission is integrated over the −21.6 to −9 km s−1 velocity range. The 2019 image has been convolved with the larger 2018 image beam shown in the lower lrft of each panel (0.″21 × 0.″18). In both maps the noise is 0.02 Jy beam−1 km s−1 and the 5σ emission contour is shown as a white light: contour. The map maxima are 21.6 and 1.67 Jybeam−1 km s−1 in 2018 and 2019), respectively. The small red contour at the image center is the 50% continuum emission from the high resolution data. Note the SW blob emission in the 2018 map (see Sect. 6.1.1).
Current usage metrics show cumulative count of Article Views (full-text article views including HTML views, PDF and ePub downloads, according to the available data) and Abstracts Views on Vision4Press platform.
Data correspond to usage on the plateform after 2015. The current usage metrics is available 48-96 hours after online publication and is updated daily on week days.
Initial download of the metrics may take a while.