Fig. 15
Download original image
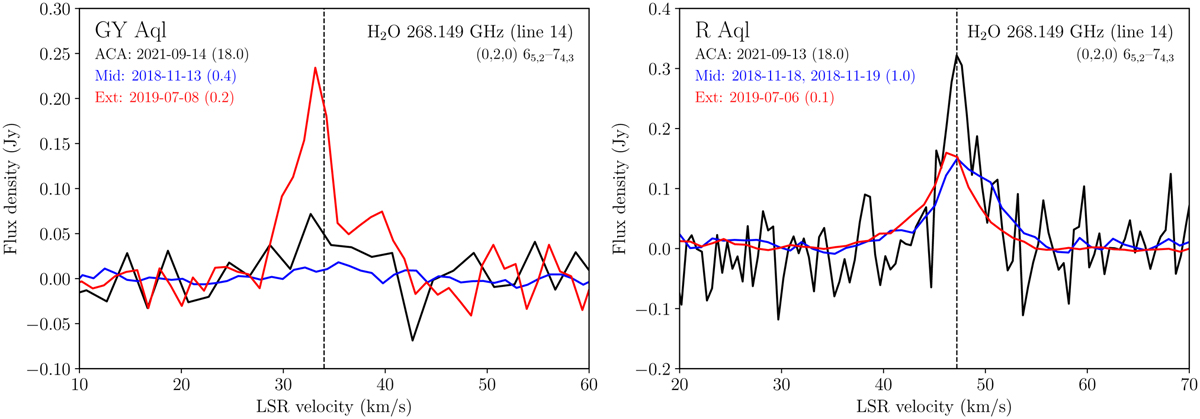
Comparison of the 268.149 GHz line profiles in GY Aq1 and R Aql observed with the ACA and the mid and extended main array configurations. The ACA spectral resolution has been degraded here to 2 and 0.5 km s−1 (GY Aql and R Aql, respectively) for comparison with the ~1 km s−1 resolution of the mid and extended configurations of the main array. The epoch of the observations are indicated in the figure labels as well as the diameter of the extraction aperture given in parentheses (18.″0, 0.″4 and 0.″2 for GY Aql and 18.″0, 1.″0 and 0.″1 for R Aql). The vertical lines show the systemic stellar velocity.
Current usage metrics show cumulative count of Article Views (full-text article views including HTML views, PDF and ePub downloads, according to the available data) and Abstracts Views on Vision4Press platform.
Data correspond to usage on the plateform after 2015. The current usage metrics is available 48-96 hours after online publication and is updated daily on week days.
Initial download of the metrics may take a while.