Fig. B.4
Download original image
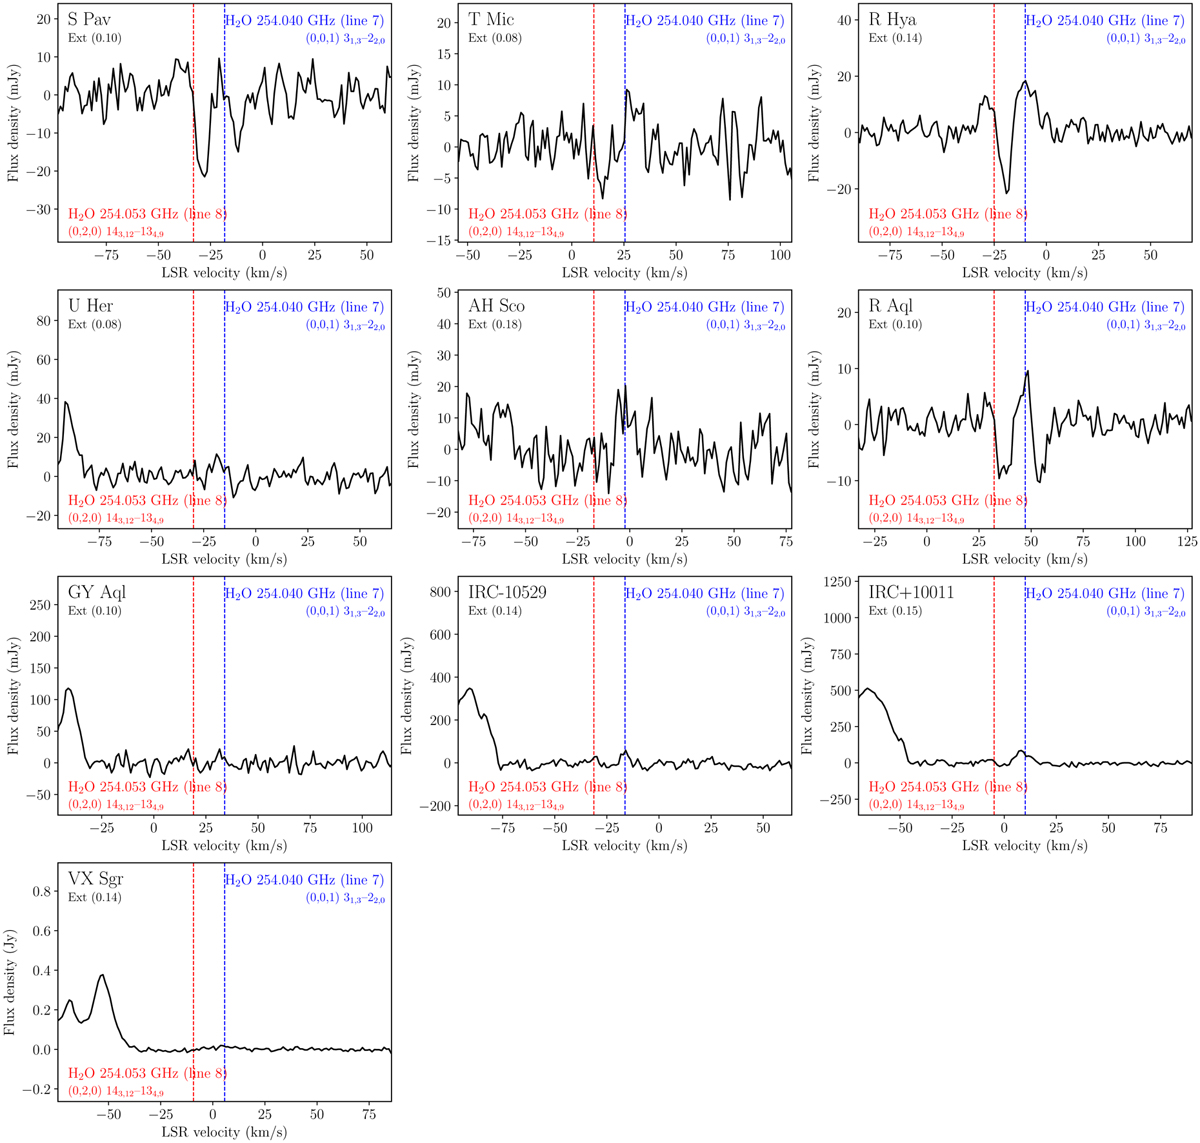
Spectra of lines 7 and 8 at 254.040 and 254.053 GHz (Table 2) extracted from the extended configuration array. The extraction diameter (in arc sec) is given in parentheses below the source name in the upper left corner of each spectrum. The blue and red vertical lines (lines 7 and 8) indicate the adopted new LSR systemic velocity (see Table 1) using the catalog rest frequencies (Table 2).
Current usage metrics show cumulative count of Article Views (full-text article views including HTML views, PDF and ePub downloads, according to the available data) and Abstracts Views on Vision4Press platform.
Data correspond to usage on the plateform after 2015. The current usage metrics is available 48-96 hours after online publication and is updated daily on week days.
Initial download of the metrics may take a while.