Fig. D.14
Download original image
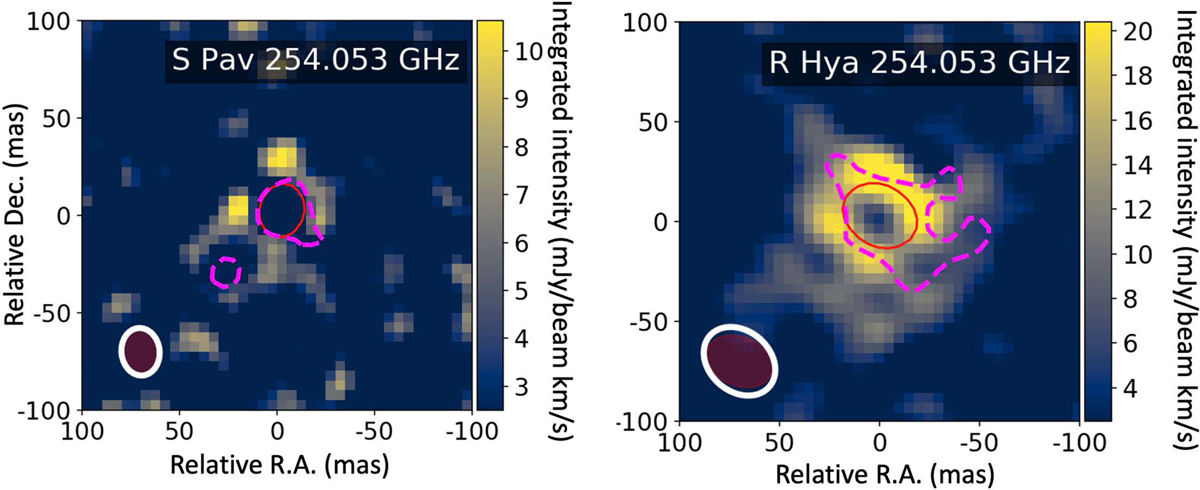
Comparison of the mom 0 absorption and emission of water at 254.053 GHz (line 8 in Table 2). Left panel: Absorption in S Pav is delimited by the dotted -5σ contour while the ring-like emission is shown in yellow. The noise level is 3 mJy/beam km s−1. Right panel: As for left panel but in R Hya. The noise level is 2.5 mJy/beam km s−1 In both panels the red contour at the map center delineates the extent at half peak intensity of the continuum emission. The HPBW is (24×19) mas at PA 6° and (25×20) mas at PA −13°) for the line (white ellipse) and continuum (dark-red ellipse) in S Pav, and (39×30) mas at PA 49° (line) and (34×25) mas at PA 67° (continuum) in R Hya. (The velocity intervals are: −2.6 to 6.5 km s−1 and −9.3 to −3.9 km s−1 for S Pav absorption and emission; −9.2 to −2.6 km s−1 and −19.1 to −10.5 km s−1 for R Hya absorption and emission.)
Current usage metrics show cumulative count of Article Views (full-text article views including HTML views, PDF and ePub downloads, according to the available data) and Abstracts Views on Vision4Press platform.
Data correspond to usage on the plateform after 2015. The current usage metrics is available 48-96 hours after online publication and is updated daily on week days.
Initial download of the metrics may take a while.