Fig. E.5
Download original image
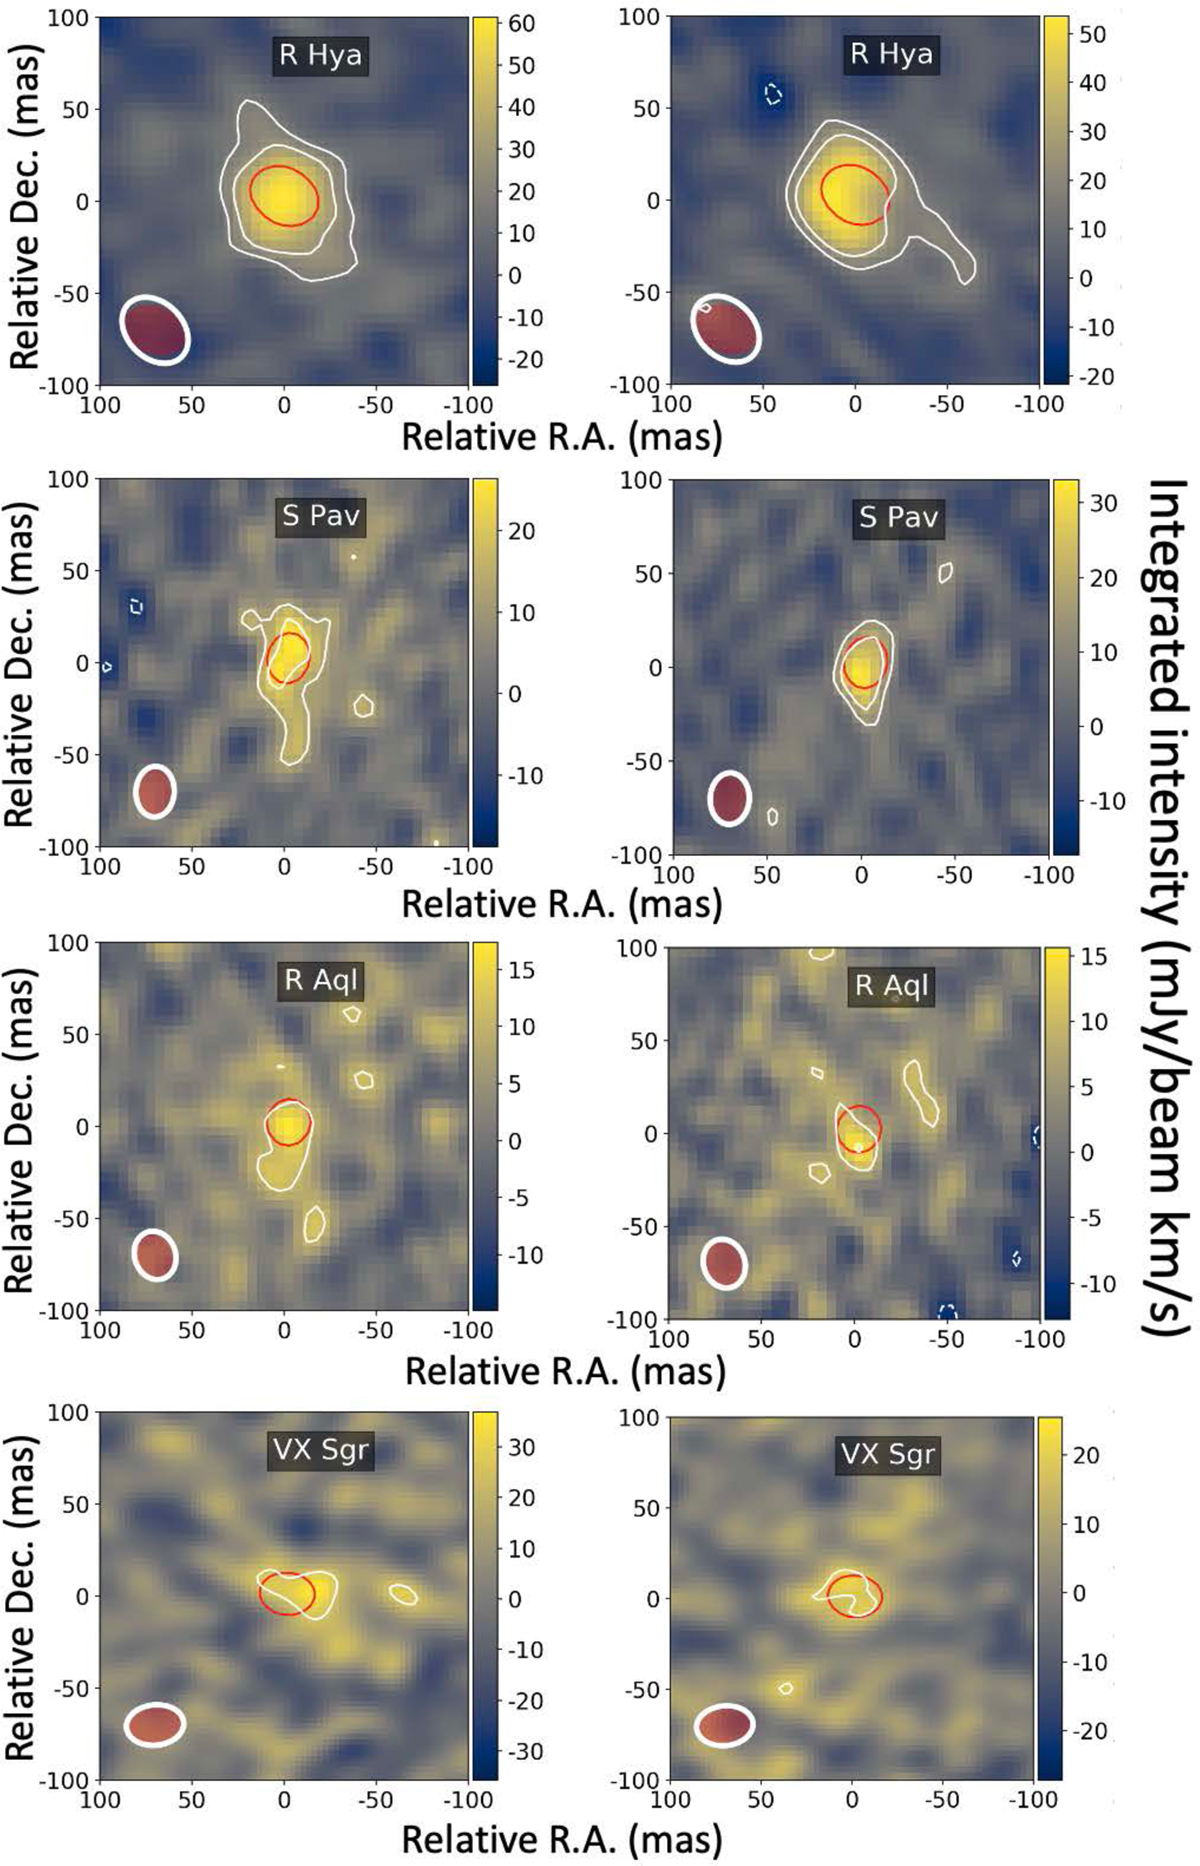
Zeroth moment maps of OH emission in the J = 27/2, F' – F'' = 13 – 13 (left panels) and 14 – 14 (right panels) transitions in R Hya, S Pav, R Aql and VX Sgr as marked. Figure caption as in Fig. 22 except for the velocity intervals. The velocity intervals irr the F' – F" = 13 – 13 and 14–14 transitions are: −10.7 to −4.1 km s−1 and −11.5 to −2.2 km s−1 in R Hya; −21.0 to −10.4 km s−1 and −21.8 to −12.5 km s−1 in S Pav; 43.3 to 51.3 km s;−1 and 46.6 to 51.7 km s−1 in R Aql; 2.9 to 21.5 km s−1 and 7.5 to 16.8 km s−1 in VX Sgr. The line HPBW is (41×30) mas, (27×21) mas, (27×22) mas and (31×22) mas at PA 45°, −3°, 10° and −84° in R Aql, S Pav, R Aql and VX Sgr, respectively. The continuum HPBWs are: (34×25) mas at PA 67° (R Hya), (25×20) mas at PA 13° (S Pav), (24×22) mas at PA −13° (R Aql) and (28×20) mas at PA 89° (VX Sgr).
Current usage metrics show cumulative count of Article Views (full-text article views including HTML views, PDF and ePub downloads, according to the available data) and Abstracts Views on Vision4Press platform.
Data correspond to usage on the plateform after 2015. The current usage metrics is available 48-96 hours after online publication and is updated daily on week days.
Initial download of the metrics may take a while.