Fig. 9
Download original image
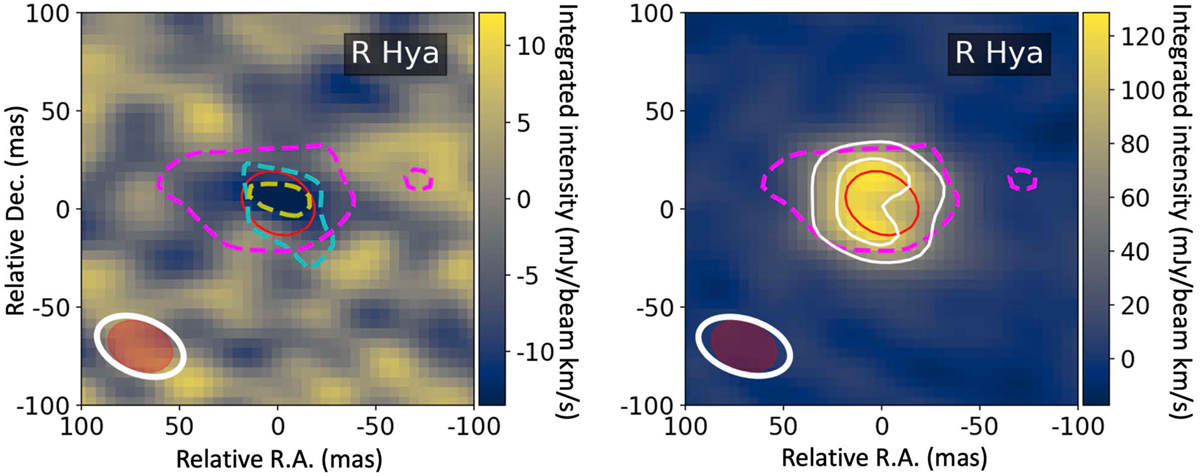
Comparison of absorption and emission lines of water with υ = 1, CO(2–1) absorption in R Hya. Left: panel: Magenta and cyan dashed contours delineate the −5σ levels of the 244.330 GHz (line 5) and 259.952 GHz (line 10) mom 0 absorption maps. The underlying map is the mom 0 absorption map of υ = 1, CO(2−1) with the yellow dashet contour at the −3σ level. The line beam width is 550 × 28 mas with 70° orientation (white ellipse in bottom left corner The red solid contour delineates the 50% level of the peak continuum emission (the continuum beam width is the dark-red ellipse in the bottom left corner). Right panel: the magenta dashed contour and red solid contour indicate the 244.330 GHz absorption and mm-wave continuum emission as in the left panel. The underlying map is the 259.952 GHz mom 0 emission, with the white solid contours at the 20 and 35σ levels. (Line and continuum beam widths as in the left panel.) The noise level is 3 mJybeam−1 km s−1 for water in both panels and 4.3 mJy/beam km s−1 for CO. The velocity intervals of the mom 0 maps are: −13.2 to 4.3 and −2.3 to t.5 km s−1 for the 244.330 and 259.952 GHz absorptions; −18.8 to −3.0 km s−1 for the 259.952 GHz emission of water; −2.2 to 6.0 km s−1 for the CO(2−1) absorption.
Current usage metrics show cumulative count of Article Views (full-text article views including HTML views, PDF and ePub downloads, according to the available data) and Abstracts Views on Vision4Press platform.
Data correspond to usage on the plateform after 2015. The current usage metrics is available 48-96 hours after online publication and is updated daily on week days.
Initial download of the metrics may take a while.