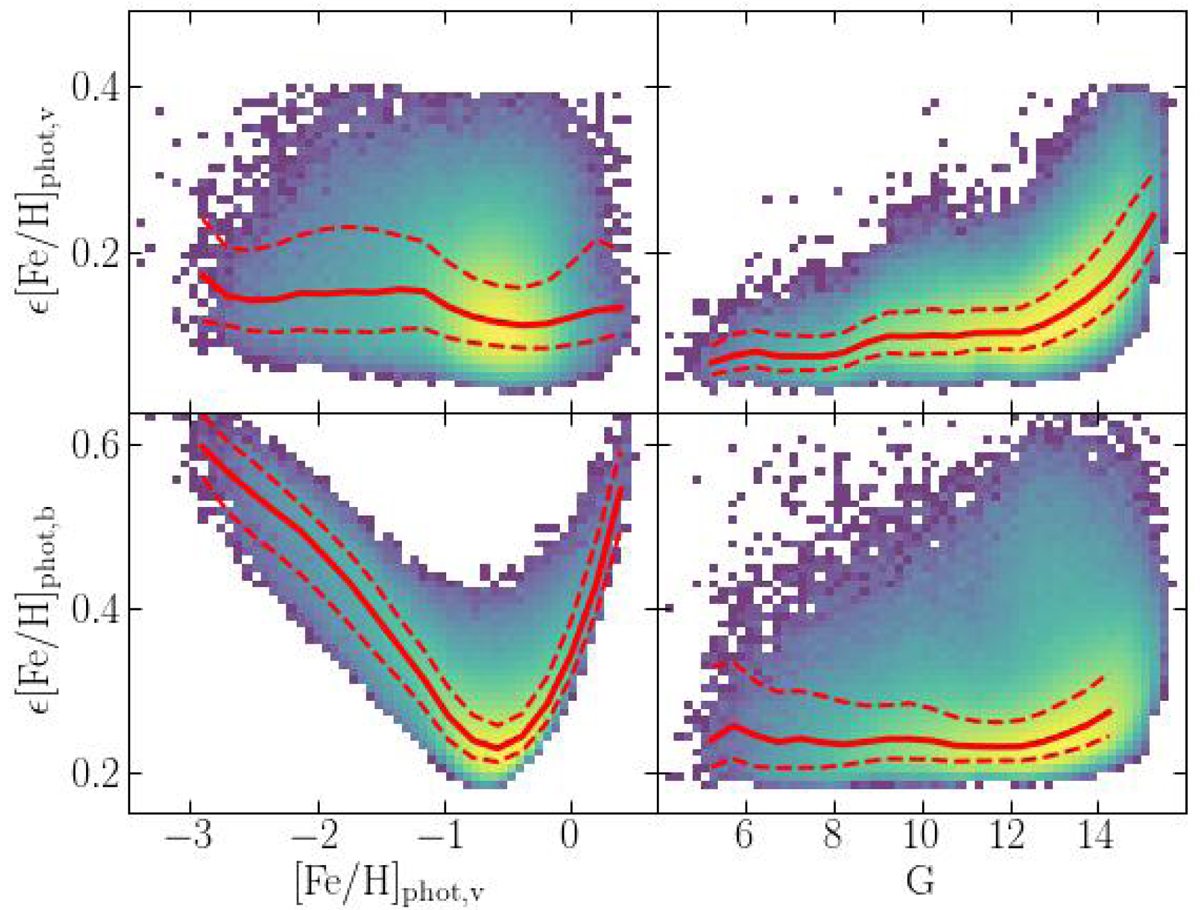
Fig. 4.
Download original image
Distributions of individual uncertainties on [Fe/H]phot, v (upper panels) and on [Fe/H]phot, b (lower panels) as a function of [Fe/H]phot, v (left panels) and of G magnitude (right panels). In all cases the colour scale is coded according to the logarithm of local density. In all panels the continuous red curve traces the median of the ϵ[Fe/H]phot, v distribution, while the red dashed curves trace the 16th and 84th percentiles of the same distribution. The scales of the y-axis between the upper and lower panels are different.
Current usage metrics show cumulative count of Article Views (full-text article views including HTML views, PDF and ePub downloads, according to the available data) and Abstracts Views on Vision4Press platform.
Data correspond to usage on the plateform after 2015. The current usage metrics is available 48-96 hours after online publication and is updated daily on week days.
Initial download of the metrics may take a while.