Fig. 3
Download original image
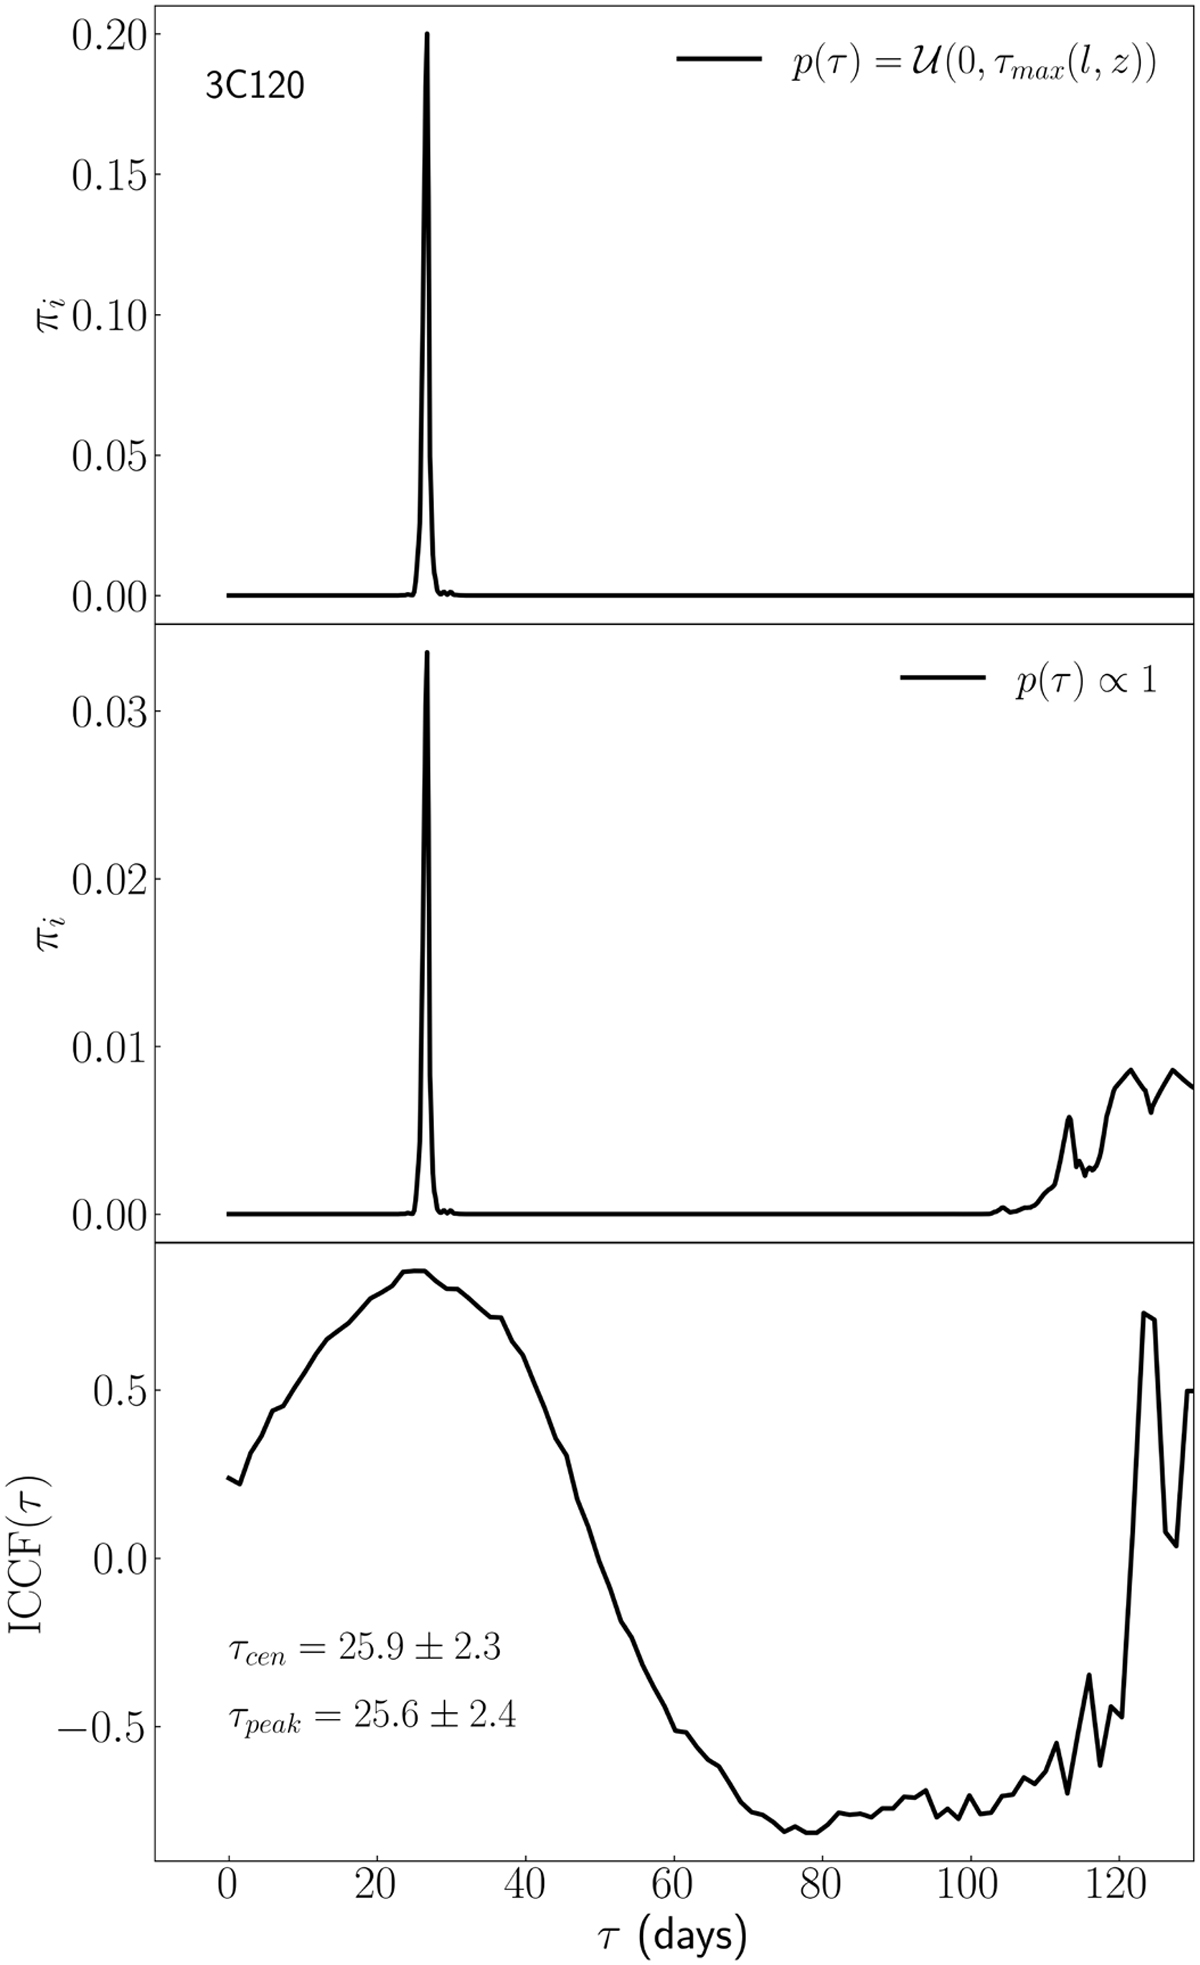
GPCC application to 3C120. Top: posterior distribution of delay with prior p(τ) = 𝓊(0, τmax(l, Z)). The peak with the highest probability corresponds to a delay of 27.6 days. Middle: posterior distribution of delay with flat prior p(τ) ∝ 1. Bottom: ICCF calculated with a sampling of 1 day for linear interpolation of fluxes. The centroid is determined using the 80% rule. Our results for the ICCF peak and centroid are identical to those of G+2012, and we show the results of G+2012 including the uncertainty estimated with the FR/RSS method. All delays are indicated in the rest frame.
Current usage metrics show cumulative count of Article Views (full-text article views including HTML views, PDF and ePub downloads, according to the available data) and Abstracts Views on Vision4Press platform.
Data correspond to usage on the plateform after 2015. The current usage metrics is available 48-96 hours after online publication and is updated daily on week days.
Initial download of the metrics may take a while.