Fig. 20.
Download original image
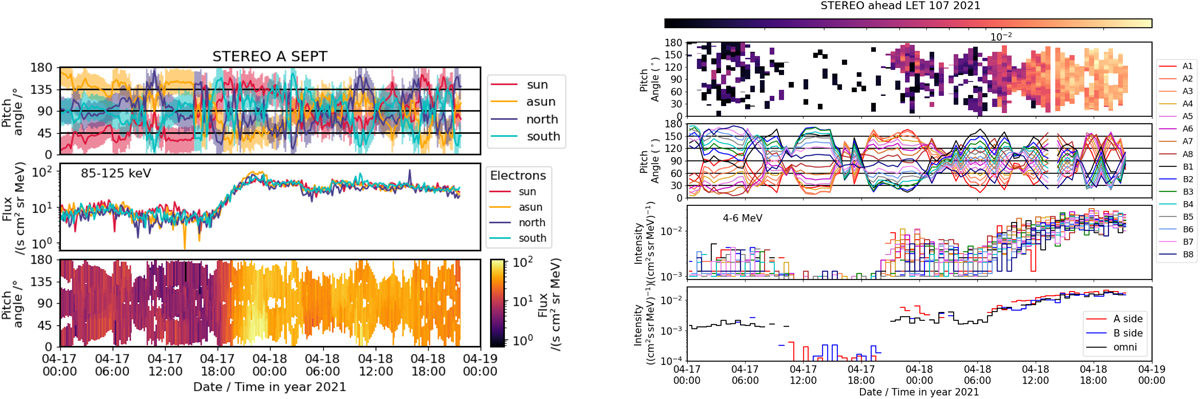
PAD of 85–125 keV electrons (left) and 4-6 MeV protons (right) observed by STEREO A/SEPT and LET, respectively. Left plot shows from top to bottom: Pitch-angle coverage of the different sensor apertures, intensities observed by each FOV, and PAD with color-coded intensities. Right plot shows from top to bottom: PAD with color-coded intensities, pitch-angle pointing of the different LET sectors, intensities observed by each sector, and average intensities measured by the eight sectors on each side of the instrument.
Current usage metrics show cumulative count of Article Views (full-text article views including HTML views, PDF and ePub downloads, according to the available data) and Abstracts Views on Vision4Press platform.
Data correspond to usage on the plateform after 2015. The current usage metrics is available 48-96 hours after online publication and is updated daily on week days.
Initial download of the metrics may take a while.