Fig. 4.
Download original image
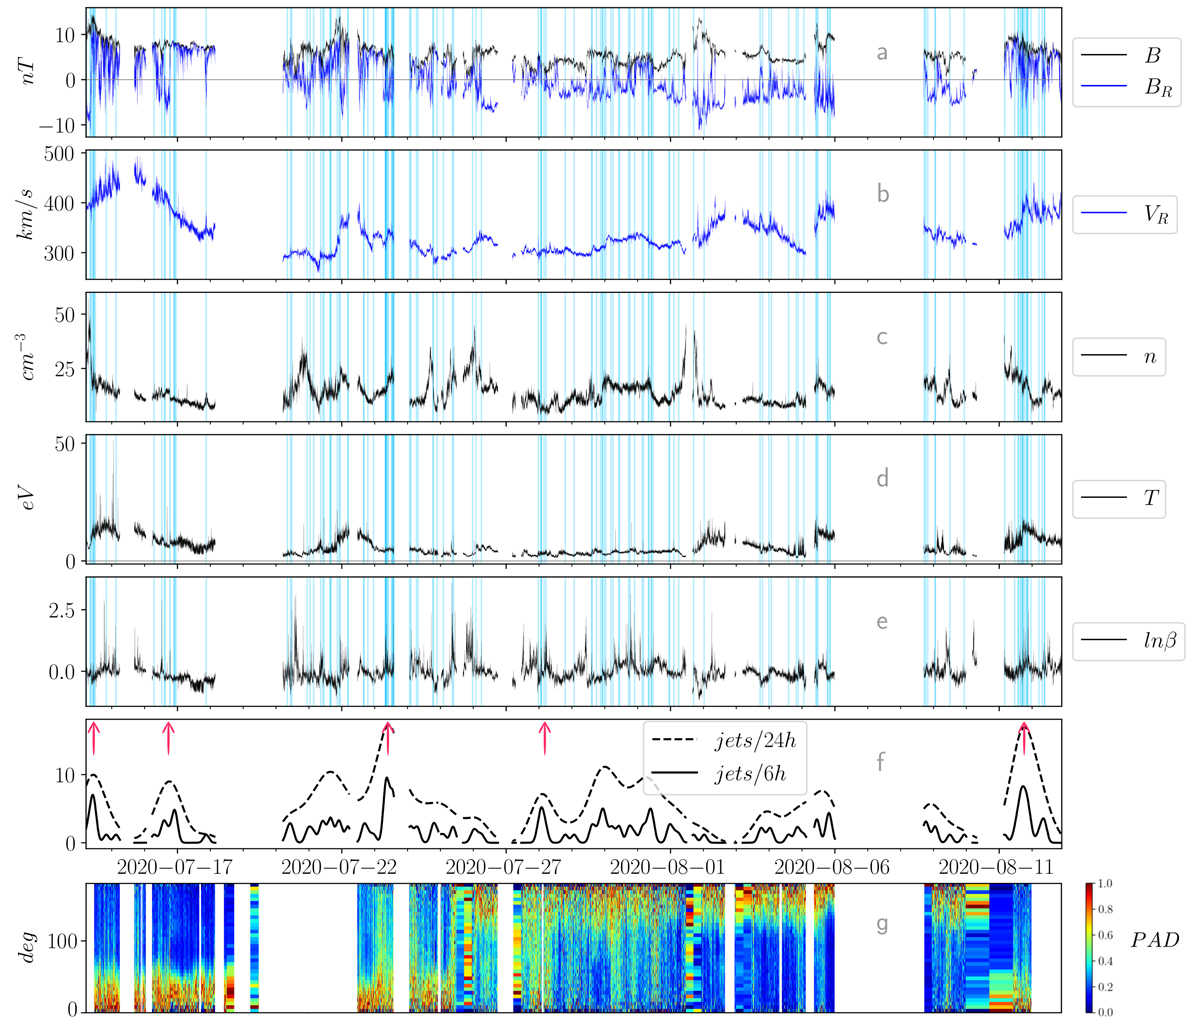
Reconnection exhaust detections over 30 days of data from July 14, 2020, at 05:15 to August 13, 2020, at 00:00. Panels a and b show the magnetic field components and its amplitude, panels c and d display the ion velocity vector components, and panel e shows the ion density. The blue shaded areas indicate the location of the reconnection exhausts we confirmed (see Table D.1) and panel f displays their occurrence computed on both a 6h and a 24h window. The red arrows highlight intervals of higher occurrence. Panel g shows the PAD of suprathermal electrons (with energy superior to 120 eV) normalised to its maximum value in each time bin.
Current usage metrics show cumulative count of Article Views (full-text article views including HTML views, PDF and ePub downloads, according to the available data) and Abstracts Views on Vision4Press platform.
Data correspond to usage on the plateform after 2015. The current usage metrics is available 48-96 hours after online publication and is updated daily on week days.
Initial download of the metrics may take a while.