Fig. 1.
Download original image
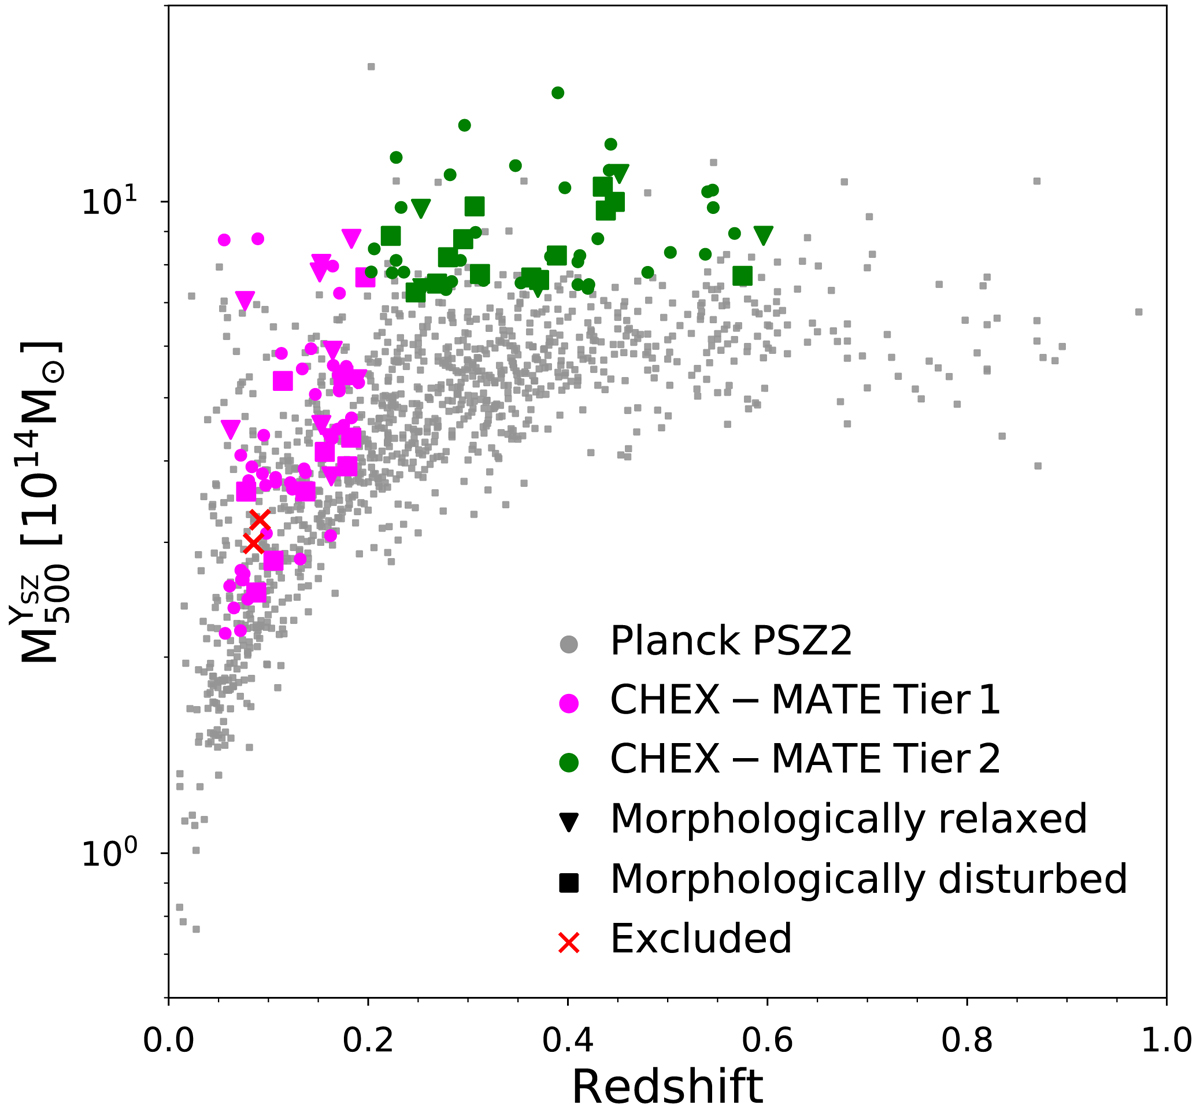
Distribution of the clusters published in the PSZ2 Planck catalogue (Planck Collaboration XXVII 2016) in the mass-redshift plane. The masses in the Planck catalogue were derived iteratively from the M500–YSZ relation calibrated using hydrostatic masses from XMM-Newton; they were not corrected for the hydrostatic equilibrium bias. The magenta and green points represent the Tier 1 and Tier 2 clusters of the CHEX–MATE sample, respectively (CHEX-MATE Collaboration 2021). The triangles and squares identify the morphologically relaxed and disturbed clusters, respectively, which were identified according to the classification scheme in Campitiello et al. (2022). The two red crosses identify the clusters excluded from the analysis of this work.
Current usage metrics show cumulative count of Article Views (full-text article views including HTML views, PDF and ePub downloads, according to the available data) and Abstracts Views on Vision4Press platform.
Data correspond to usage on the plateform after 2015. The current usage metrics is available 48-96 hours after online publication and is updated daily on week days.
Initial download of the metrics may take a while.