Fig. 10.
Download original image
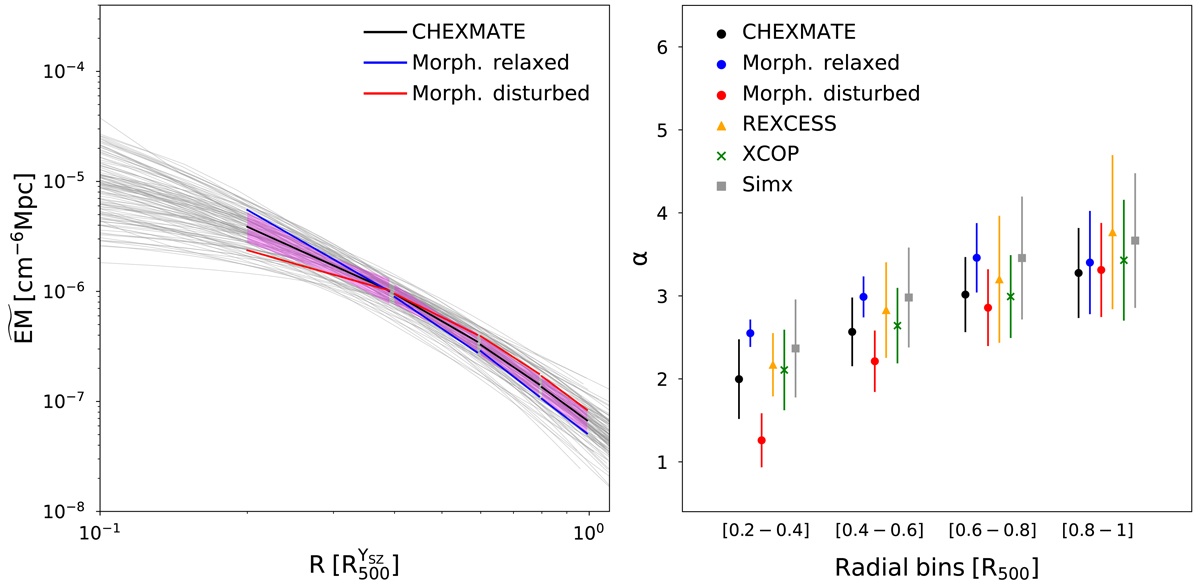
Results of the fit of the CHEX–MATE ![]() profiles using broken power laws. Left panel: fit of the median CHEX–MATE
profiles using broken power laws. Left panel: fit of the median CHEX–MATE ![]() profiles shown with grey lines with a power law in four radial bins. The bins are [0.2 − 0.4],[0.4 − 0.6],[0.6 − 0.8], and [0.8 − 1] and are in units of
profiles shown with grey lines with a power law in four radial bins. The bins are [0.2 − 0.4],[0.4 − 0.6],[0.6 − 0.8], and [0.8 − 1] and are in units of ![]() . For each radial bin, the black solid line represents the best fit of the power law shown in Eq. (6). The magenta envelope was obtained considering the dispersion of the fitted parameters (A and α in Eq. (6)). The blue and red solid lines represent the best fit of the profiles of the morphologically relaxed and disturbed clusters, respectively. Right panel: median values of the power law indexes, α, obtained from the fit of the CHEX–MATE, X-COP, REXCESS, and Simx samples in the four radial bins shown in the left panel. For each value we report its dispersion.
. For each radial bin, the black solid line represents the best fit of the power law shown in Eq. (6). The magenta envelope was obtained considering the dispersion of the fitted parameters (A and α in Eq. (6)). The blue and red solid lines represent the best fit of the profiles of the morphologically relaxed and disturbed clusters, respectively. Right panel: median values of the power law indexes, α, obtained from the fit of the CHEX–MATE, X-COP, REXCESS, and Simx samples in the four radial bins shown in the left panel. For each value we report its dispersion.
Current usage metrics show cumulative count of Article Views (full-text article views including HTML views, PDF and ePub downloads, according to the available data) and Abstracts Views on Vision4Press platform.
Data correspond to usage on the plateform after 2015. The current usage metrics is available 48-96 hours after online publication and is updated daily on week days.
Initial download of the metrics may take a while.