Fig. 11.
Download original image
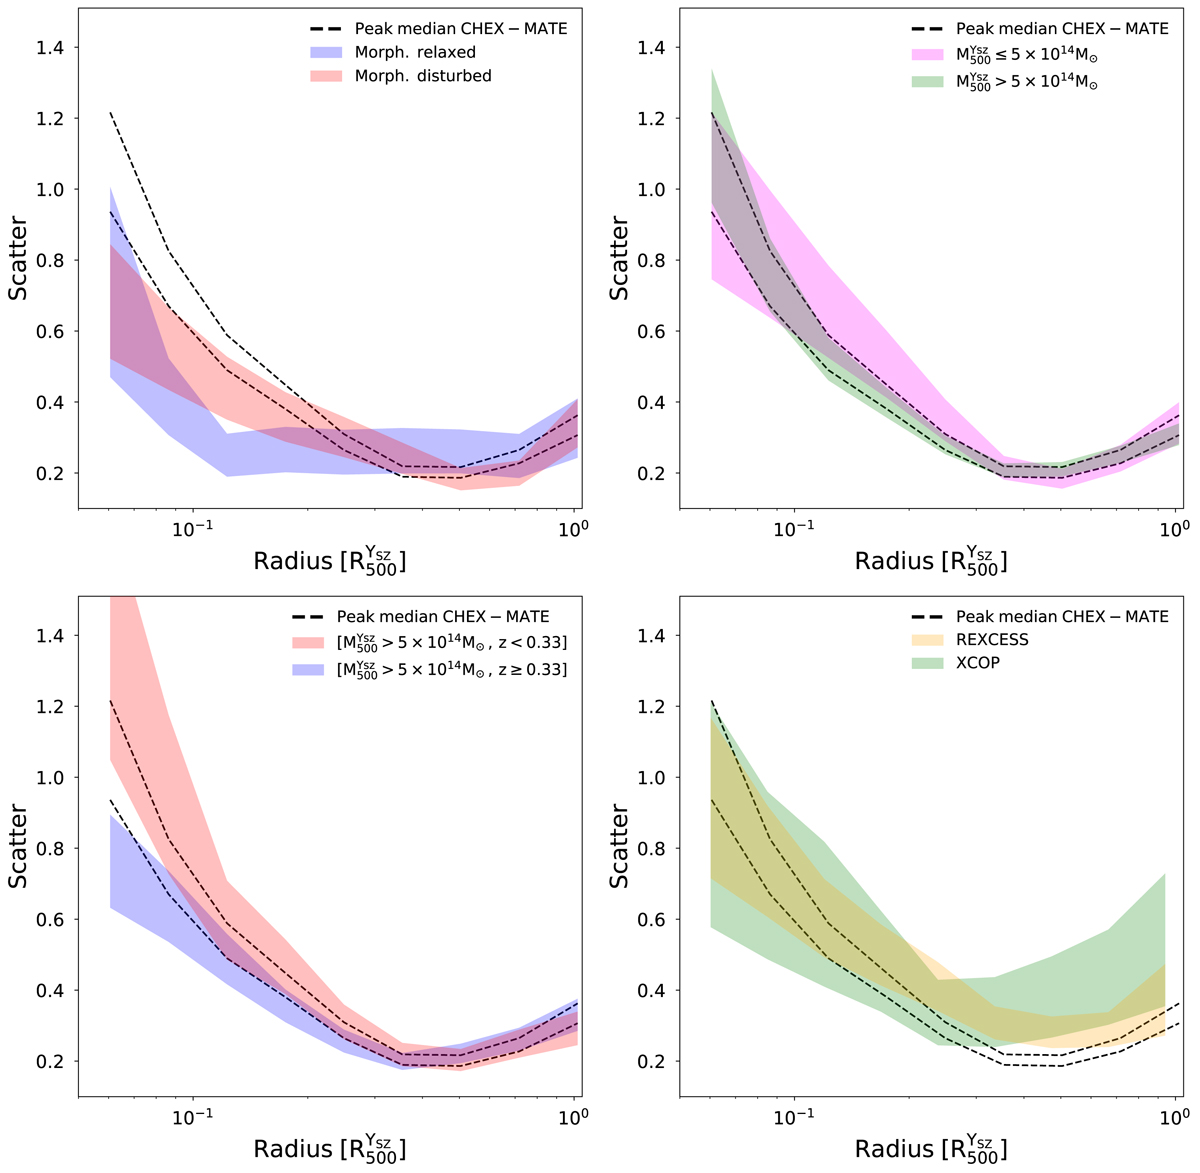
Scatter of the ![]() CHEX–MATE, X-COP, and REXCESS profiles. Top-left panel: comparison between the scatter of the CHEX–MATE sample and the morphologically selected sub-samples. Black dotted lines identify the ±1σ scatter between the
CHEX–MATE, X-COP, and REXCESS profiles. Top-left panel: comparison between the scatter of the CHEX–MATE sample and the morphologically selected sub-samples. Black dotted lines identify the ±1σ scatter between the ![]() profiles of the CHEX–MATE sample. The scatter between the profiles of morphologically relaxed and disturbed clusters are shown with blue and red envelopes, respectively. The width of the envelopes corresponds to the 1σ uncertainty. Top-right panel: comparison between the scatter of the CHEX–MATE sample and the mass selected sub-samples. Green and magenta envelopes represent the scatter between the
profiles of the CHEX–MATE sample. The scatter between the profiles of morphologically relaxed and disturbed clusters are shown with blue and red envelopes, respectively. The width of the envelopes corresponds to the 1σ uncertainty. Top-right panel: comparison between the scatter of the CHEX–MATE sample and the mass selected sub-samples. Green and magenta envelopes represent the scatter between the ![]() profiles of the low- and high-mass sub-samples, respectively. Bottom-left panel: investigation of evolution of the scatter. Blue and red envelopes represent the scatter between the profiles of the hi-mass clusters,
profiles of the low- and high-mass sub-samples, respectively. Bottom-left panel: investigation of evolution of the scatter. Blue and red envelopes represent the scatter between the profiles of the hi-mass clusters, ![]() , of the low- and high- redshift samples, respectively. Bottom-right panel: comparison between the scatter of the CHEX–MATE with X-COP (Ghirardini et al. 2019) and REXCESS (Croston et al. 2008) samples. The X-COP and REXCESS scatters are shown with green and orange envelopes, respectively. We recall that the scaling of the X-COP and REXCESS profiles was performed using temperatures obtained differently than those for CHEX–MATE, see Sect. 5.4 for details.
, of the low- and high- redshift samples, respectively. Bottom-right panel: comparison between the scatter of the CHEX–MATE with X-COP (Ghirardini et al. 2019) and REXCESS (Croston et al. 2008) samples. The X-COP and REXCESS scatters are shown with green and orange envelopes, respectively. We recall that the scaling of the X-COP and REXCESS profiles was performed using temperatures obtained differently than those for CHEX–MATE, see Sect. 5.4 for details.
Current usage metrics show cumulative count of Article Views (full-text article views including HTML views, PDF and ePub downloads, according to the available data) and Abstracts Views on Vision4Press platform.
Data correspond to usage on the plateform after 2015. The current usage metrics is available 48-96 hours after online publication and is updated daily on week days.
Initial download of the metrics may take a while.