Fig. 12.
Download original image
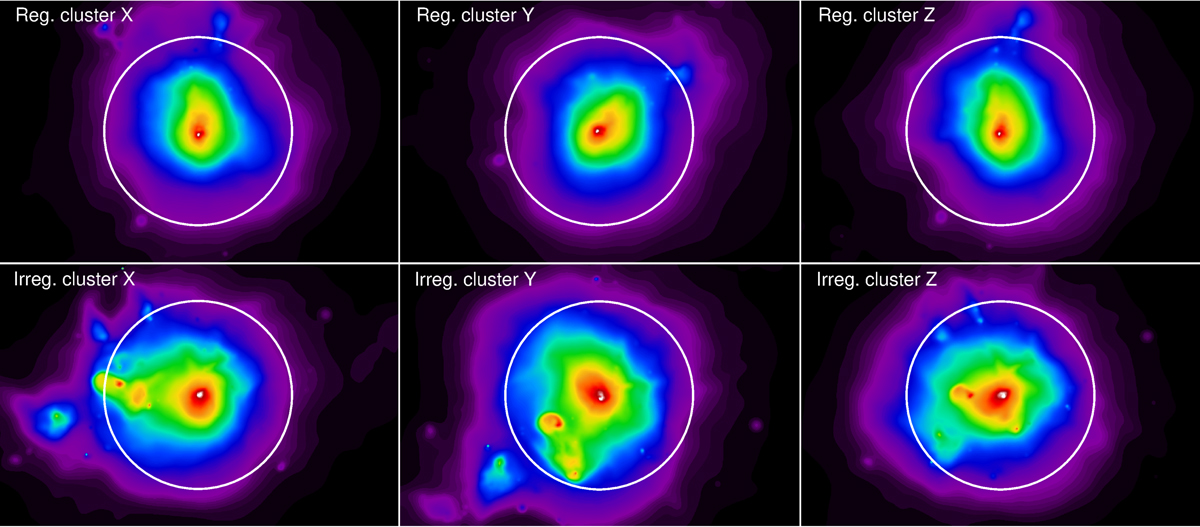
EM maps of two of the simulated clusters used in this work projected along the lines of sight X, Y, and Z. The top row shows a cluster whose morphology appears roundish in the three projections considered. On the bottom we show, on the contrary, a cluster whose morphology is particularly complex and appears different in each of the three projections. We refer to the cluster in the top row as regular and the latter as irregular. The white circle indicates R500.
Current usage metrics show cumulative count of Article Views (full-text article views including HTML views, PDF and ePub downloads, according to the available data) and Abstracts Views on Vision4Press platform.
Data correspond to usage on the plateform after 2015. The current usage metrics is available 48-96 hours after online publication and is updated daily on week days.
Initial download of the metrics may take a while.