Open Access
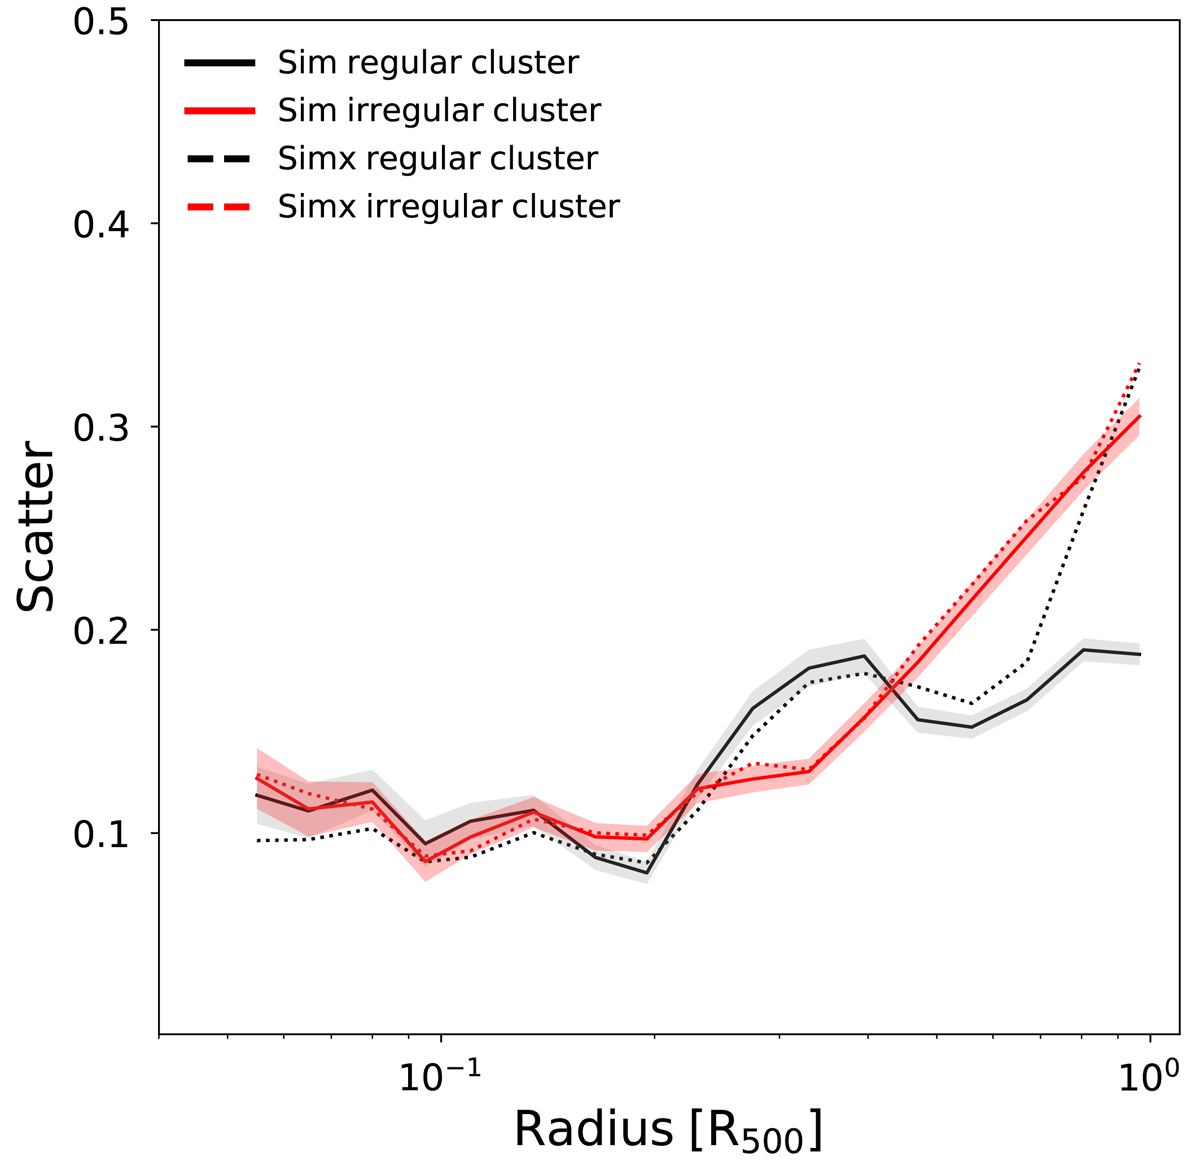
Fig. 13.
Download original image
Projection scatter of the regular and irregular clusters in Fig. 12. The scatters are shown with black and red solid lines, respectively. The black and red envelops represent the dispersion. The black and red dotted lines refer to the projection scatter computed using the Simx profiles.
Current usage metrics show cumulative count of Article Views (full-text article views including HTML views, PDF and ePub downloads, according to the available data) and Abstracts Views on Vision4Press platform.
Data correspond to usage on the plateform after 2015. The current usage metrics is available 48-96 hours after online publication and is updated daily on week days.
Initial download of the metrics may take a while.