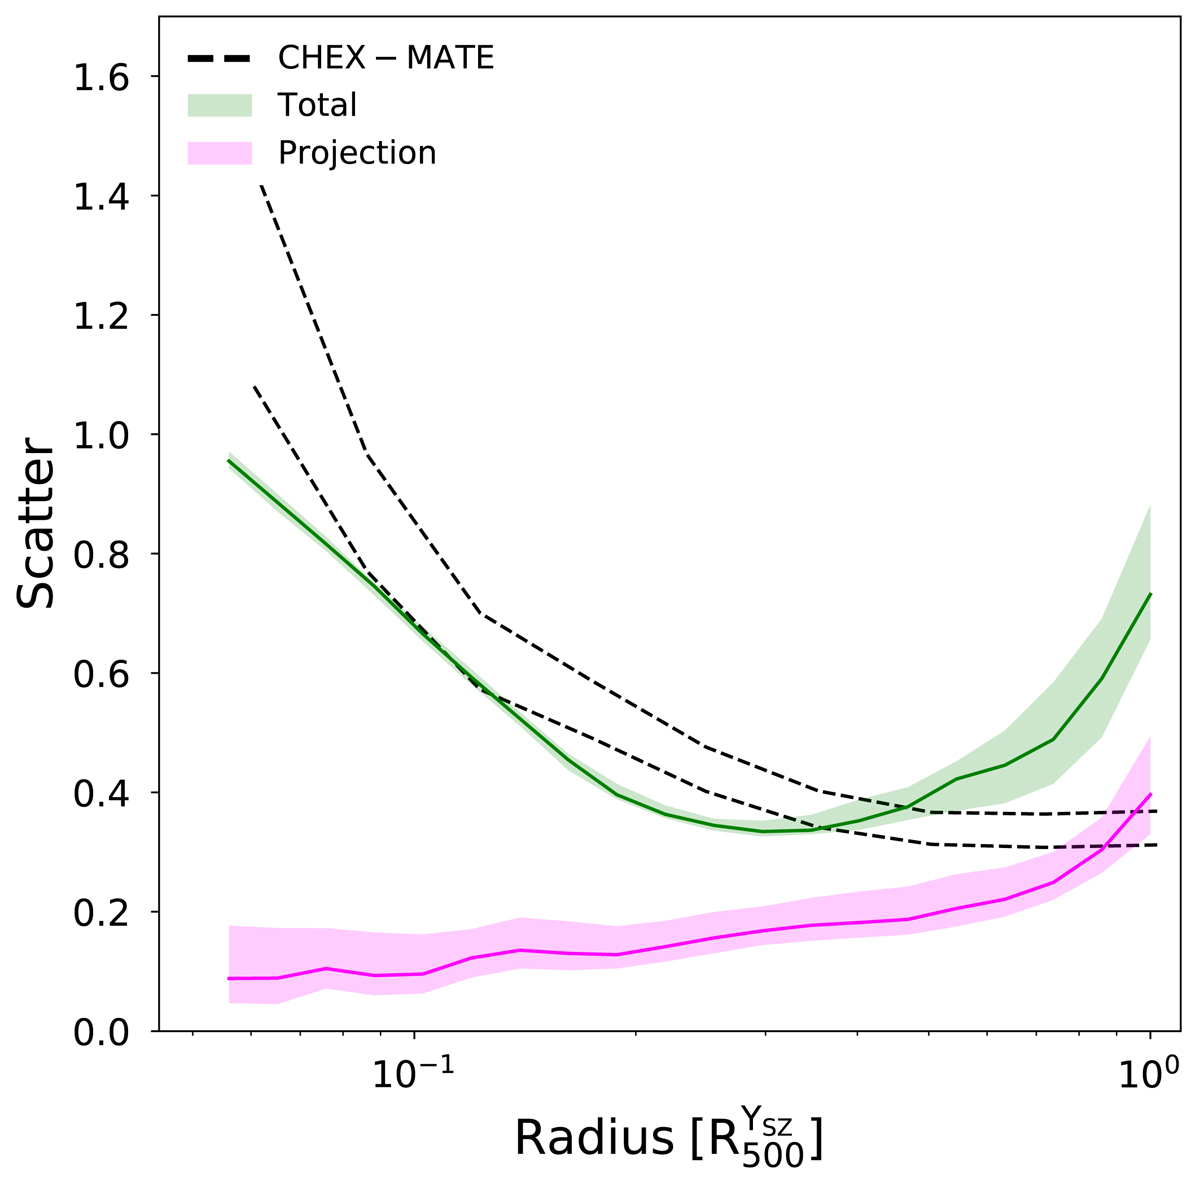
Fig. 15.
Download original image
Comparison between the scatter of the CHEX–MATE sample and the total and projection terms of the simulations. The CHEX–MATE scatter is shown using dashed black lines. The medians of the total and projection terms are represented with green and magenta solid lines, respectively. Their 68% dispersions are represented using envelopes coloured accordingly.
Current usage metrics show cumulative count of Article Views (full-text article views including HTML views, PDF and ePub downloads, according to the available data) and Abstracts Views on Vision4Press platform.
Data correspond to usage on the plateform after 2015. The current usage metrics is available 48-96 hours after online publication and is updated daily on week days.
Initial download of the metrics may take a while.