Fig. A.1.
Download original image
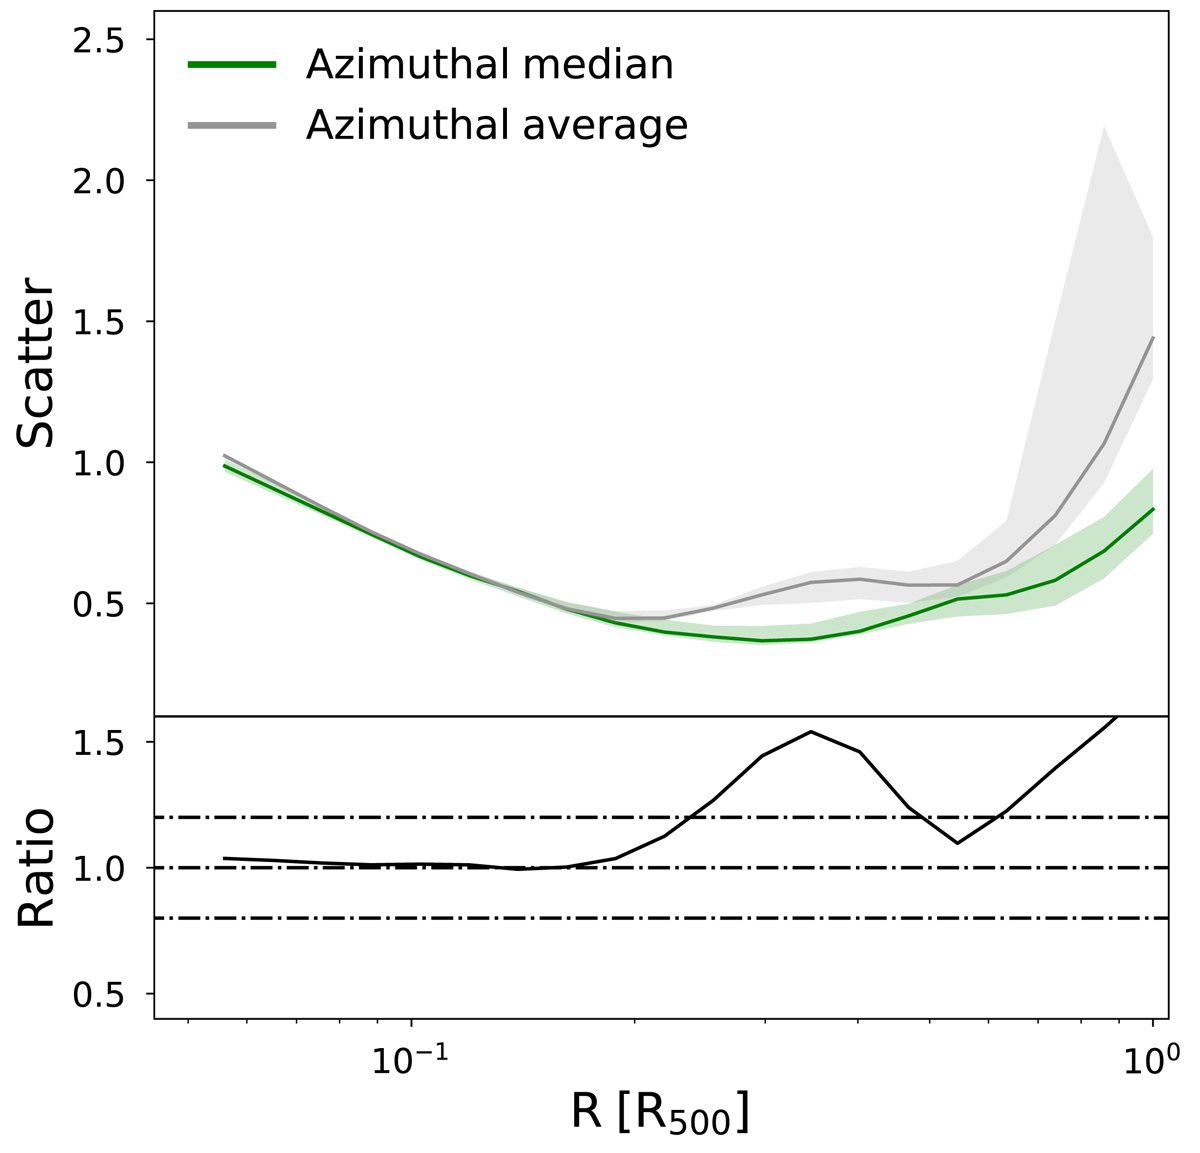
Comparison between the total scatters computed using the azimuthal mean and median profiles. Top: Medians of the total from THE THREE HUNDRED scatters computed using the azimuthal mean and median EM profiles. These are shown with green and grey lines, respectively. The 68% dispersion is shown with the coloured envelopes. Bottom: Ratio between the median of the total scatters computed using the azimuthal averaged profiles over the median computed using the azimuthal median profiles. The dashed-dotted lines indicate the identity line and the ±20% levels.
Current usage metrics show cumulative count of Article Views (full-text article views including HTML views, PDF and ePub downloads, according to the available data) and Abstracts Views on Vision4Press platform.
Data correspond to usage on the plateform after 2015. The current usage metrics is available 48-96 hours after online publication and is updated daily on week days.
Initial download of the metrics may take a while.