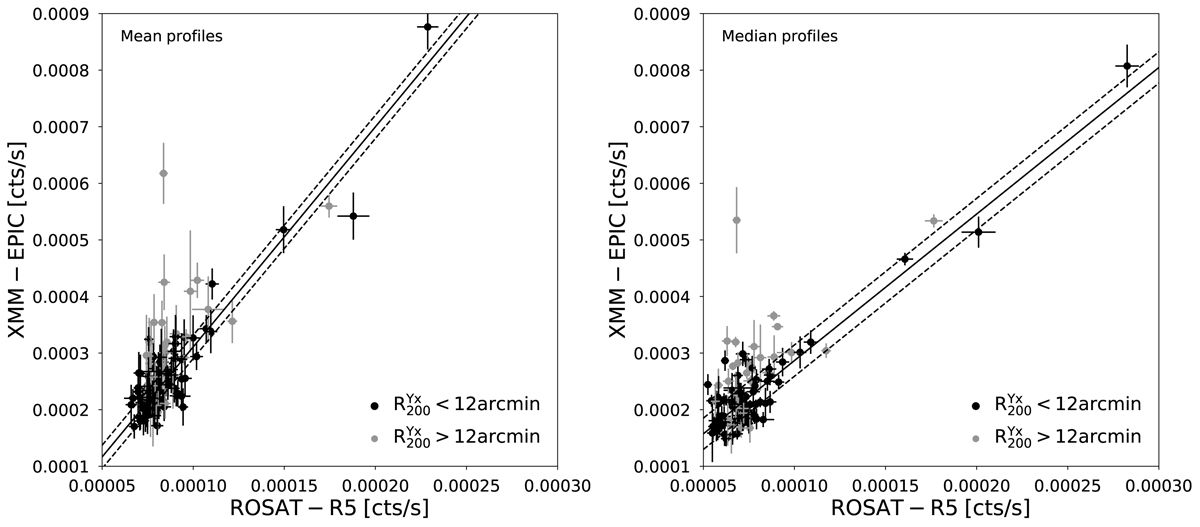
Fig. B.1.
Download original image
Calibration of the sky background count rate between XMM-Newton and ROSAT-PSPC. Left panel: Relation between the sky background count rate as measured using the XMM-Newton mean SX profiles and ROSAT-PSPC in the R5, [0.56-1.21] keV, energy band. The black points represent the clusters for which ![]() is less than 12 arcmin and that have been used to fit the relations. The grey points are the clusters filling the field of view, their
is less than 12 arcmin and that have been used to fit the relations. The grey points are the clusters filling the field of view, their ![]() being greater than 12 arcmin. The solid line represents the cross correlation obtained via the linear regression. The dashed lines represent the intrinsic scatter of the relation. Right panel: Same as the left panel except for the fact that the XMM-Newton count rate is measured using the median SX profiles.
being greater than 12 arcmin. The solid line represents the cross correlation obtained via the linear regression. The dashed lines represent the intrinsic scatter of the relation. Right panel: Same as the left panel except for the fact that the XMM-Newton count rate is measured using the median SX profiles.
Current usage metrics show cumulative count of Article Views (full-text article views including HTML views, PDF and ePub downloads, according to the available data) and Abstracts Views on Vision4Press platform.
Data correspond to usage on the plateform after 2015. The current usage metrics is available 48-96 hours after online publication and is updated daily on week days.
Initial download of the metrics may take a while.