Fig. D.1.
Download original image
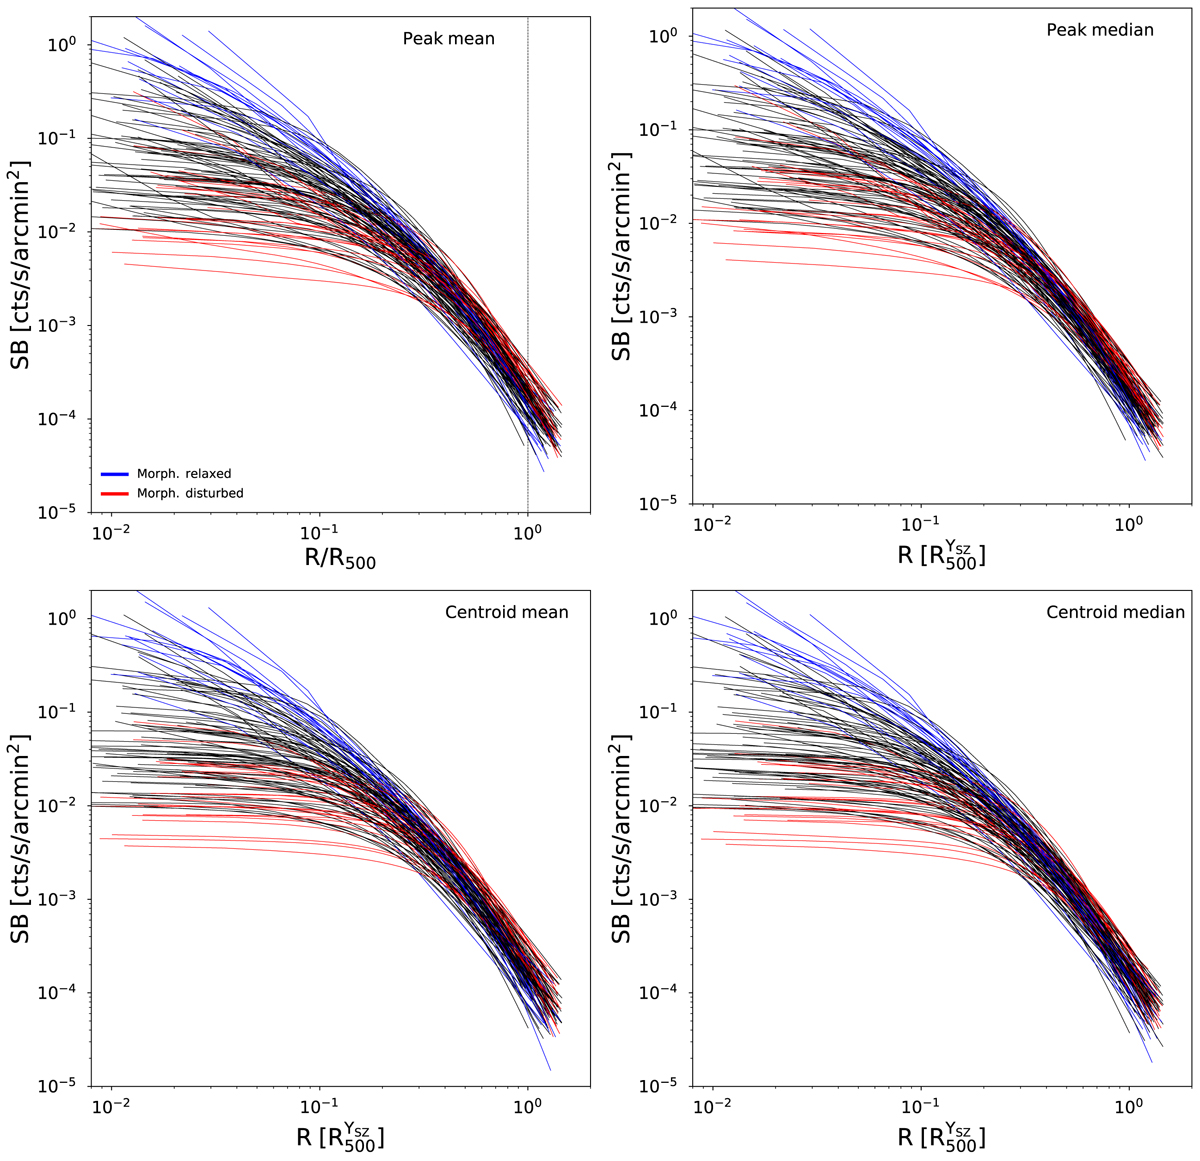
Surface brightness radial profiles of the CHEX–MATE sample. Left column: Azimuthal averaged surface brightness profiles of the CHEX–MATE sample centred on the X-peak and the centroid in the top and bottom panels, respectively. Blue and red solid lines represent morphologically relaxed and disturbed clusters, respectively. The black solid vertical line identifies ![]() . Right column: Same as left column but for profiles extracted computing the azimuthal median.
. Right column: Same as left column but for profiles extracted computing the azimuthal median.
Current usage metrics show cumulative count of Article Views (full-text article views including HTML views, PDF and ePub downloads, according to the available data) and Abstracts Views on Vision4Press platform.
Data correspond to usage on the plateform after 2015. The current usage metrics is available 48-96 hours after online publication and is updated daily on week days.
Initial download of the metrics may take a while.