Fig. 2.
Download original image
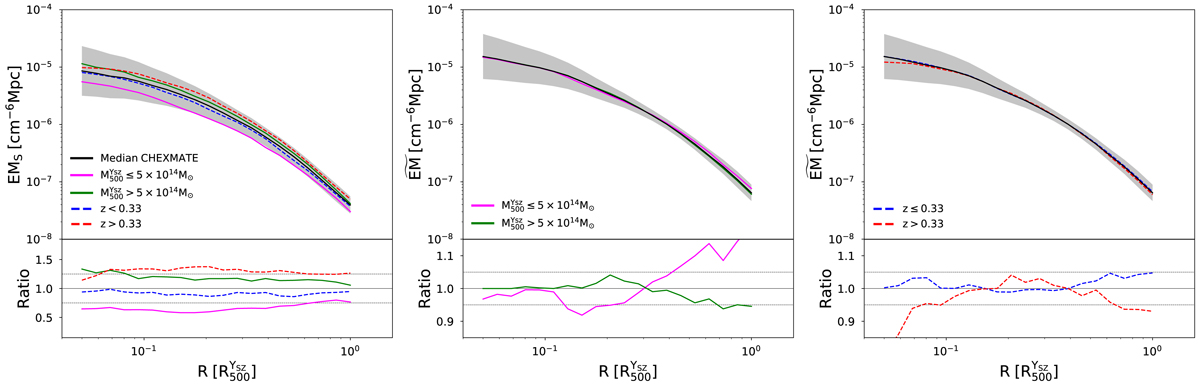
Comparison of the statistical properties of the CHEX–MATE EM profiles divided in redshift and mass selected sub-samples. Top-left panel: median of the EMS profiles centred on the X-ray peak scaled for self-similar evolution using Eq. (4). The dispersion is shown with the black solid line and the grey envelope. The magenta and green solid lines represent the median of the low-mass, ![]() , and high-mass,
, and high-mass, ![]() , sub-samples, respectively. The red and blue dotted lines represent the medians of the low-, z ≤ 0.33, and high-redshift, z > 0.33, sub-samples, respectively. Bottom-left panel: ratio of the sub-samples medians with respect to the full CHEX–MATE sample median. The dotted horizontal lines represent the 25% plus and minus levels. Middle panels: comparison of the statistical properties of the
, sub-samples, respectively. The red and blue dotted lines represent the medians of the low-, z ≤ 0.33, and high-redshift, z > 0.33, sub-samples, respectively. Bottom-left panel: ratio of the sub-samples medians with respect to the full CHEX–MATE sample median. The dotted horizontal lines represent the 25% plus and minus levels. Middle panels: comparison of the statistical properties of the ![]() profiles scaled to account also for mass and redshift evolution divided in mass selected sub-samples. On the top panel we show the same as in the top left panel except the medians and the dispersion were computed using profiles scaled with Eq. (5). On the bottom we show the ratio between the medians of the sub-samples as respect to the median of the full sample. The dotted horizontal lines in the lower-middle panel represent the plus and minus 5% levels. Right panels: comparison of the statistical properties of the scaled
profiles scaled to account also for mass and redshift evolution divided in mass selected sub-samples. On the top panel we show the same as in the top left panel except the medians and the dispersion were computed using profiles scaled with Eq. (5). On the bottom we show the ratio between the medians of the sub-samples as respect to the median of the full sample. The dotted horizontal lines in the lower-middle panel represent the plus and minus 5% levels. Right panels: comparison of the statistical properties of the scaled ![]() profiles divided in redshift selected sub-samples. On the top panel we show the same as in the top left panel except that the medians and the dispersion were computed using the profiles scaled with Eq. (5). On the bottom we show the ratio between the medians of the sub-samples as respect to the median of the full CHEX–MATE sample.
profiles divided in redshift selected sub-samples. On the top panel we show the same as in the top left panel except that the medians and the dispersion were computed using the profiles scaled with Eq. (5). On the bottom we show the ratio between the medians of the sub-samples as respect to the median of the full CHEX–MATE sample.
Current usage metrics show cumulative count of Article Views (full-text article views including HTML views, PDF and ePub downloads, according to the available data) and Abstracts Views on Vision4Press platform.
Data correspond to usage on the plateform after 2015. The current usage metrics is available 48-96 hours after online publication and is updated daily on week days.
Initial download of the metrics may take a while.