Fig. 4.
Download original image
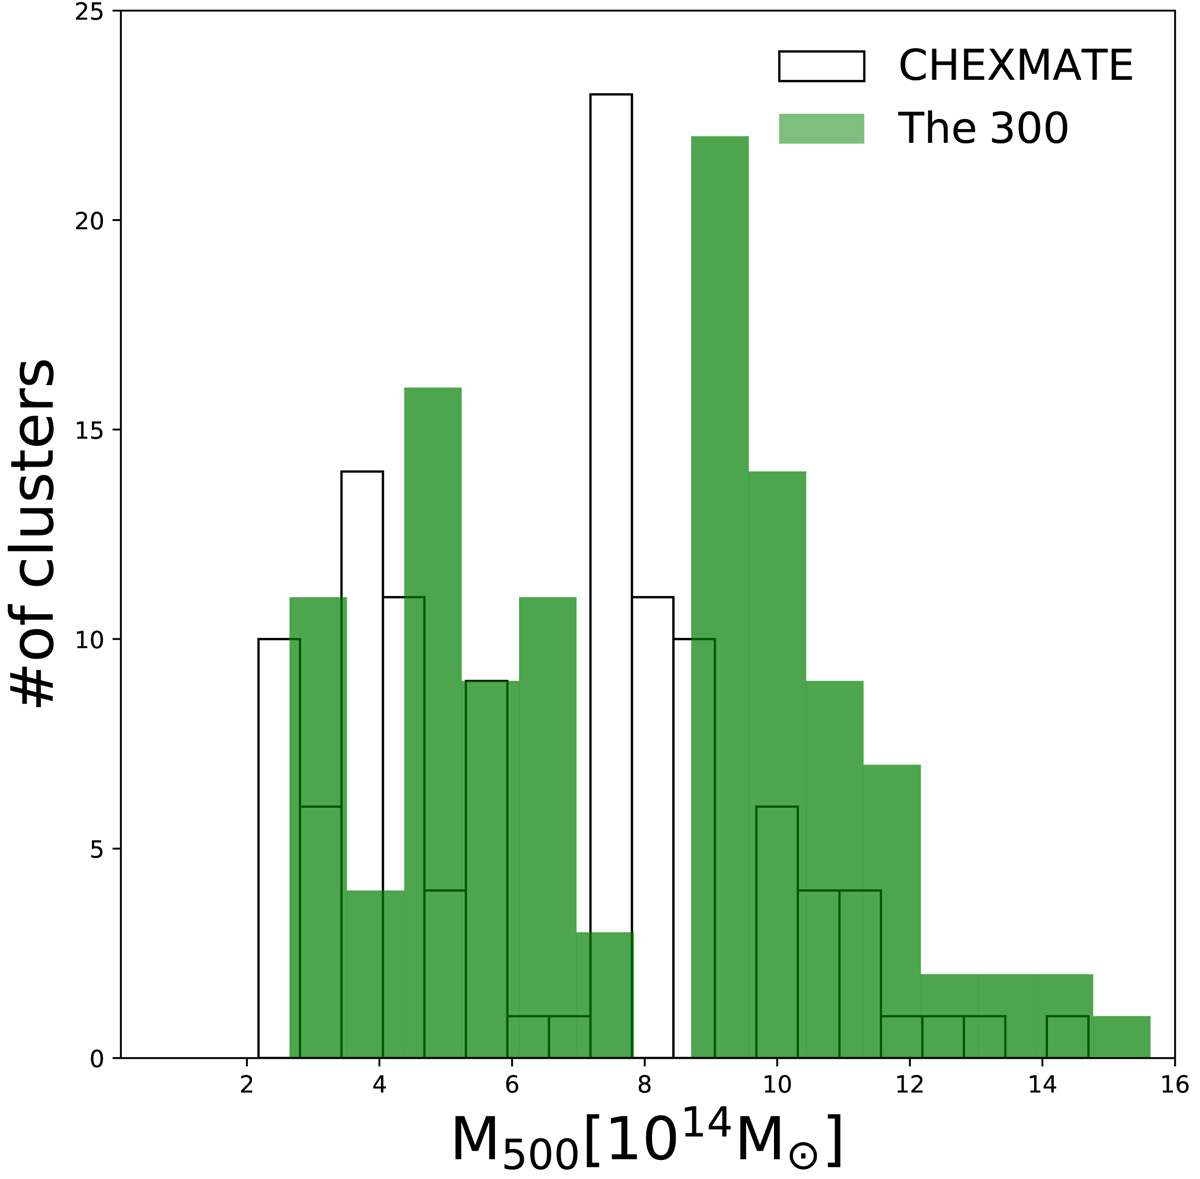
Mass distribution of the CHEX–MATE and THE THREE HUNDRED samples. These are shown with black empty and green polygons, respectively. The gap between ![]() is an artefact from the CHEX–MATE sample being divided into two tiers, shown in Fig. 1. The shift between the two distributions is due to the fact that the CHEX–MATE masses are assumed to be 0.8 lower than the true mass due to the hydrostatic bias. For more details, refer to Sect. 4.
is an artefact from the CHEX–MATE sample being divided into two tiers, shown in Fig. 1. The shift between the two distributions is due to the fact that the CHEX–MATE masses are assumed to be 0.8 lower than the true mass due to the hydrostatic bias. For more details, refer to Sect. 4.
Current usage metrics show cumulative count of Article Views (full-text article views including HTML views, PDF and ePub downloads, according to the available data) and Abstracts Views on Vision4Press platform.
Data correspond to usage on the plateform after 2015. The current usage metrics is available 48-96 hours after online publication and is updated daily on week days.
Initial download of the metrics may take a while.