Fig. 5.
Download original image
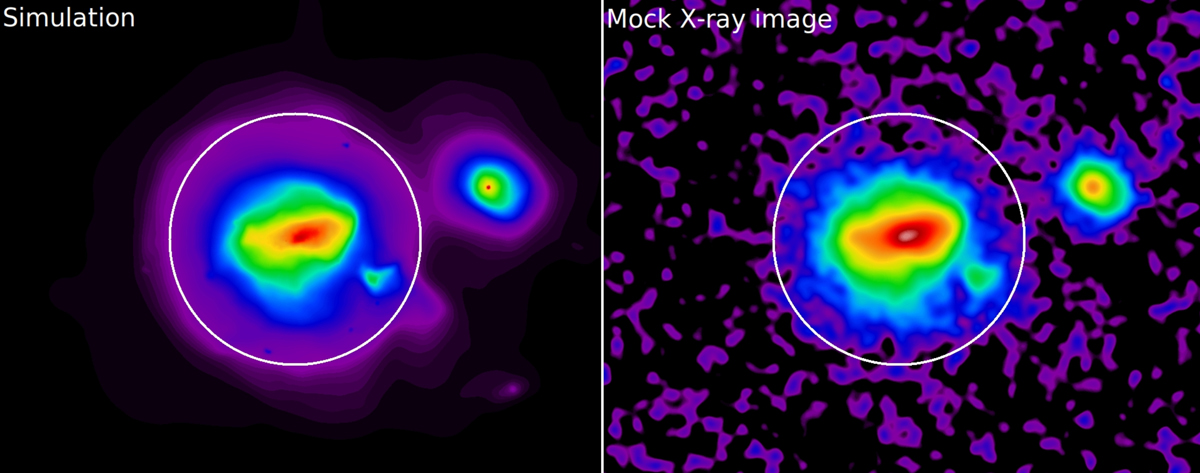
Example of the creation of the X-ray mock images. Left panel: EM map of a simulated cluster of our sample. The white circle encompasses R500. Right panel: Mock X-ray background-subtracted image in the [0.5–2] keV band of the same object shown in the left panel after we applied the procedures simulating typical X-ray observation effects. These are described in detail in Sect. 4.1.
Current usage metrics show cumulative count of Article Views (full-text article views including HTML views, PDF and ePub downloads, according to the available data) and Abstracts Views on Vision4Press platform.
Data correspond to usage on the plateform after 2015. The current usage metrics is available 48-96 hours after online publication and is updated daily on week days.
Initial download of the metrics may take a while.