Fig. 6.
Download original image
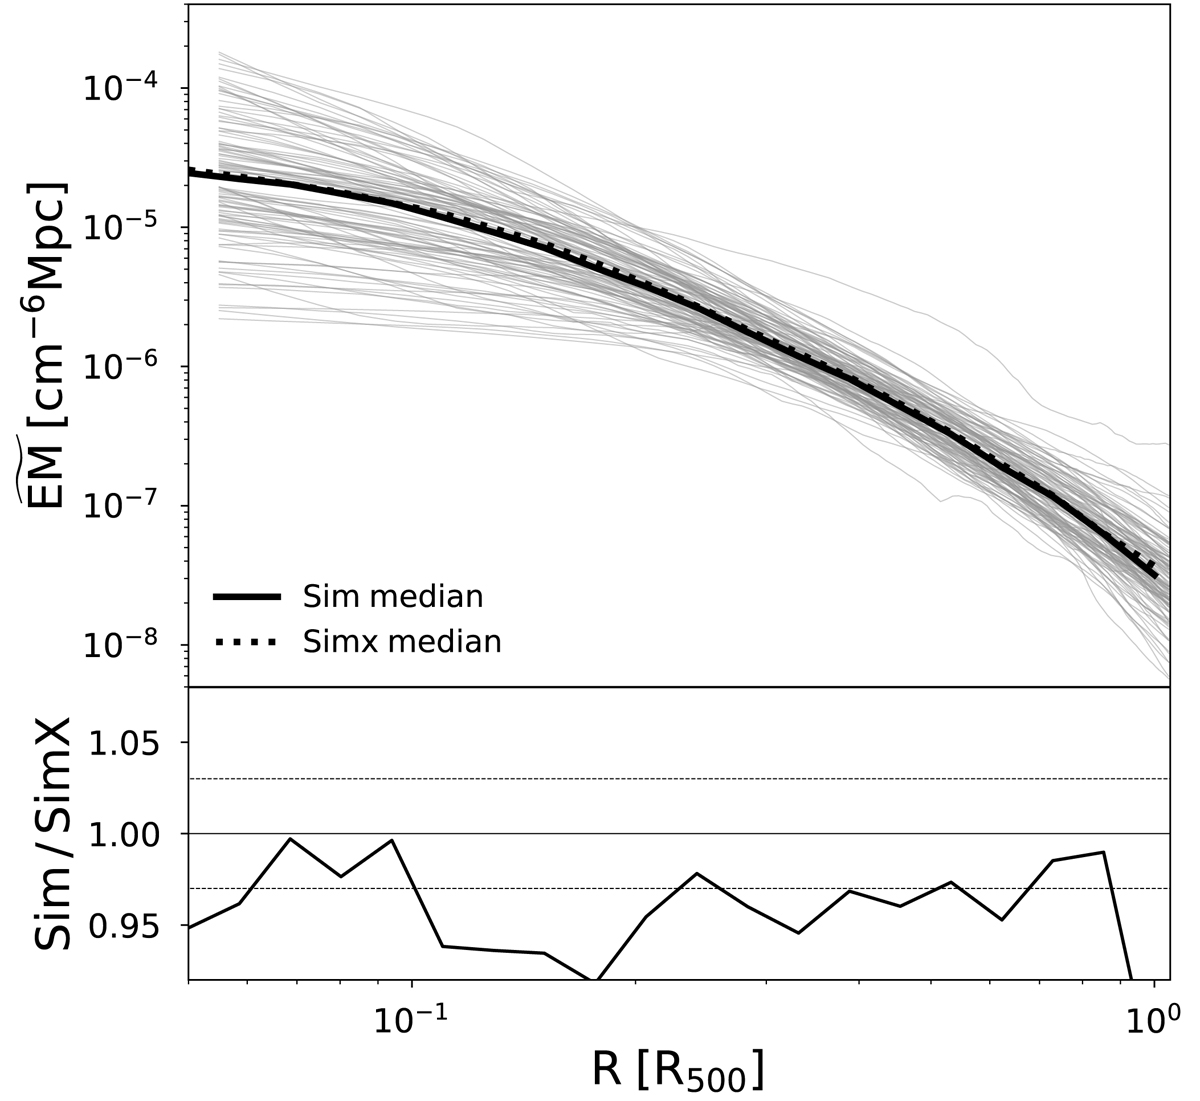
Comparison between the Sim and Simx profiles. Top panel: comparison between the medians of the Sim and Simx ![]() profiles extracted from random projections. These are shown with black solid and dotted lines, respectively. The grey solid lines represent the Sim profiles. Bottom panel: ratio between the Sim over the Simx median. The black solid and dotted lines correspond to the identity and the ±2% levels, respectively.
profiles extracted from random projections. These are shown with black solid and dotted lines, respectively. The grey solid lines represent the Sim profiles. Bottom panel: ratio between the Sim over the Simx median. The black solid and dotted lines correspond to the identity and the ±2% levels, respectively.
Current usage metrics show cumulative count of Article Views (full-text article views including HTML views, PDF and ePub downloads, according to the available data) and Abstracts Views on Vision4Press platform.
Data correspond to usage on the plateform after 2015. The current usage metrics is available 48-96 hours after online publication and is updated daily on week days.
Initial download of the metrics may take a while.