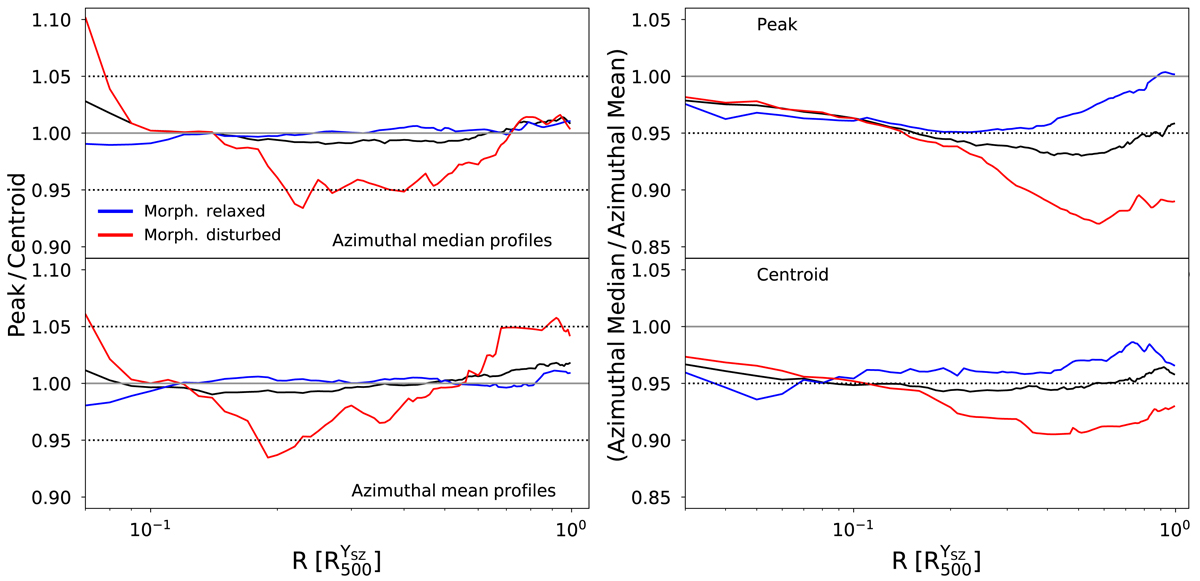
Fig. 7.
Download original image
Ratio between the medians of the EM profiles obtained using the X-ray peak or the centroid as centre and using the azimuthal average or median. Left panels: ratio between the medians of the profiles centred on the peak and centroid. The top and bottom panels show the ratio computed using the azimuthal median and azimuthal mean ![]() profiles, respectively. The black solid lines represent the median of the ratio considering the whole sample. The blue and red solid lines show the ratio considering only the morphologically relaxed and disturbed clusters, respectively. The grey solid lines indicate the identity line, and the dotted lines represent the plus and minus 5% levels. Right panels: same as the left panels except we show the ratio between the medians of the azimuthal median and mean
profiles, respectively. The black solid lines represent the median of the ratio considering the whole sample. The blue and red solid lines show the ratio considering only the morphologically relaxed and disturbed clusters, respectively. The grey solid lines indicate the identity line, and the dotted lines represent the plus and minus 5% levels. Right panels: same as the left panels except we show the ratio between the medians of the azimuthal median and mean ![]() profiles. The top and bottom panels show the ratio computed using the profiles extracted with the X-ray peak and the centroid as centre, respectively. The legend of the solid and dotted lines is the same as in the left panels except for the fact that we show only the minus 5% level.
profiles. The top and bottom panels show the ratio computed using the profiles extracted with the X-ray peak and the centroid as centre, respectively. The legend of the solid and dotted lines is the same as in the left panels except for the fact that we show only the minus 5% level.
Current usage metrics show cumulative count of Article Views (full-text article views including HTML views, PDF and ePub downloads, according to the available data) and Abstracts Views on Vision4Press platform.
Data correspond to usage on the plateform after 2015. The current usage metrics is available 48-96 hours after online publication and is updated daily on week days.
Initial download of the metrics may take a while.