Fig. 8.
Download original image
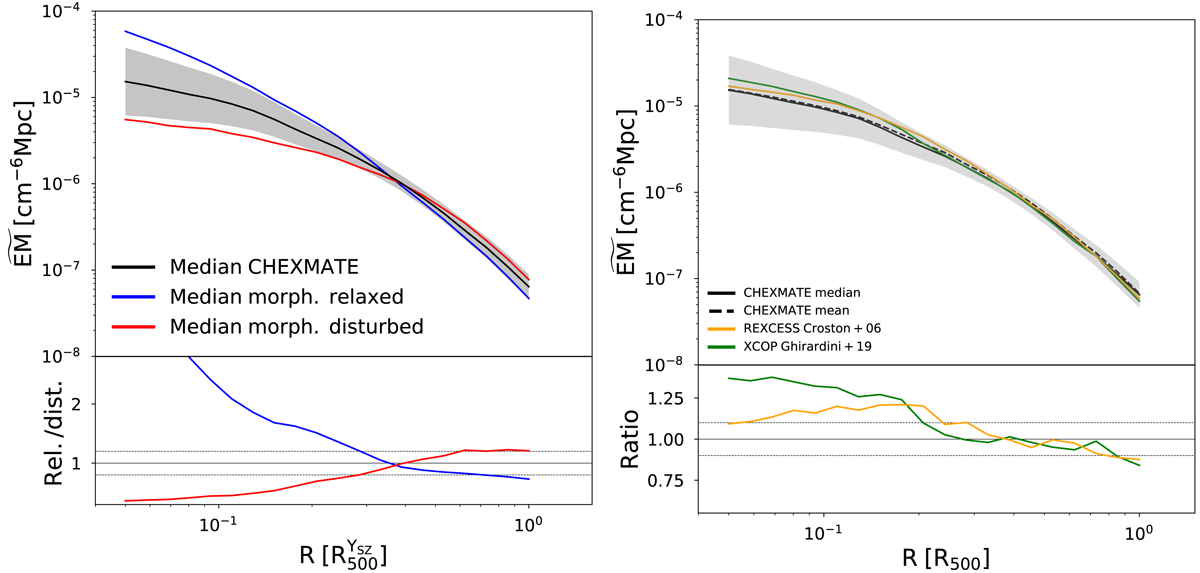
Comparison of the statistical properties of the CHEX–MATE ![]() profiles with morphologically selected sub-samples and the X-COP and REXCESS samples. Top-left panel: median of the
profiles with morphologically selected sub-samples and the X-COP and REXCESS samples. Top-left panel: median of the ![]() peak median profiles of the CHEX–MATE sample. Its dispersion is shown with the black solid line and the grey envelope. The blue and red solid lines represent the median of the profiles derived from the morphologically relaxed and disturbed objects, respectively. Bottom-left panel: ratio of the median of the morphologically relaxed and disturbed
peak median profiles of the CHEX–MATE sample. Its dispersion is shown with the black solid line and the grey envelope. The blue and red solid lines represent the median of the profiles derived from the morphologically relaxed and disturbed objects, respectively. Bottom-left panel: ratio of the median of the morphologically relaxed and disturbed ![]() profiles over the median of the full CHEX–MATE sample. The same colour coding as above is used. The dotted lines represent 0.8 and 1.2 values and are shown for reference. Top-right panel: Same as the left panel except the median of the azimuthal mean profiles is shown. The median is indicated with the dotted black line. The median of the X-COP (Ghirardini et al. 2019) and REXCESS (Croston et al. 2008)
profiles over the median of the full CHEX–MATE sample. The same colour coding as above is used. The dotted lines represent 0.8 and 1.2 values and are shown for reference. Top-right panel: Same as the left panel except the median of the azimuthal mean profiles is shown. The median is indicated with the dotted black line. The median of the X-COP (Ghirardini et al. 2019) and REXCESS (Croston et al. 2008) ![]() profiles are shown with green and orange solid lines, respectively. Bottom-left panel: ratio between the median of X-COP and REXCESS samples to the CHEX–MATE median. The REXCESS profiles were extracted performing an azimuthal average. For this reason, we show the ratio between the median of the REXCESS profiles and the median of the CHEX–MATE azimuthal mean profiles.
profiles are shown with green and orange solid lines, respectively. Bottom-left panel: ratio between the median of X-COP and REXCESS samples to the CHEX–MATE median. The REXCESS profiles were extracted performing an azimuthal average. For this reason, we show the ratio between the median of the REXCESS profiles and the median of the CHEX–MATE azimuthal mean profiles.
Current usage metrics show cumulative count of Article Views (full-text article views including HTML views, PDF and ePub downloads, according to the available data) and Abstracts Views on Vision4Press platform.
Data correspond to usage on the plateform after 2015. The current usage metrics is available 48-96 hours after online publication and is updated daily on week days.
Initial download of the metrics may take a while.