Fig. 9.
Download original image
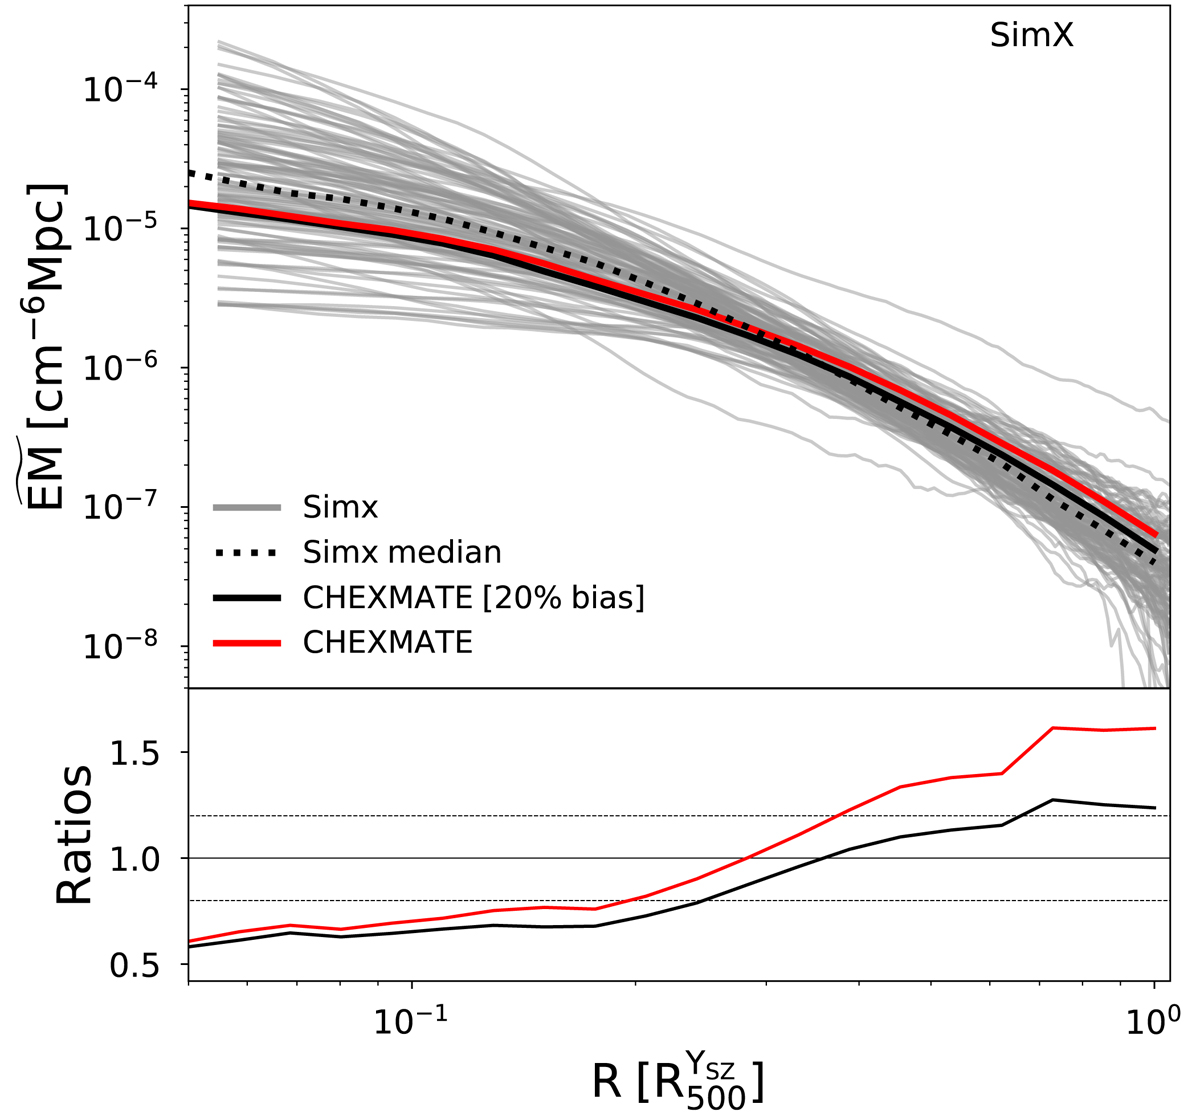
Top panel: Simx ![]() profiles and their median. The profiles are shown with grey solid lines and their median with a black dashed line. The Simx profiles were extracted from a randomly chosen line of sight for each cluster. The red solid line identifies the median of the CHEX–MATE sample. The black solid line is the median of the CHEX–MATE sample assuming a 20% bias on the mass (i.e. each profile has been scaled for
profiles and their median. The profiles are shown with grey solid lines and their median with a black dashed line. The Simx profiles were extracted from a randomly chosen line of sight for each cluster. The red solid line identifies the median of the CHEX–MATE sample. The black solid line is the median of the CHEX–MATE sample assuming a 20% bias on the mass (i.e. each profile has been scaled for ![]() ; see Sect. 4 for details). Bottom panel: ratio of the median of the CHEX–MATE with and without correction for hydrostatic bias and the median of the Simx simulations. The CHEX-MATE median with the correction is shown with the red line and the median without it is shown with the black line.
; see Sect. 4 for details). Bottom panel: ratio of the median of the CHEX–MATE with and without correction for hydrostatic bias and the median of the Simx simulations. The CHEX-MATE median with the correction is shown with the red line and the median without it is shown with the black line.
Current usage metrics show cumulative count of Article Views (full-text article views including HTML views, PDF and ePub downloads, according to the available data) and Abstracts Views on Vision4Press platform.
Data correspond to usage on the plateform after 2015. The current usage metrics is available 48-96 hours after online publication and is updated daily on week days.
Initial download of the metrics may take a while.