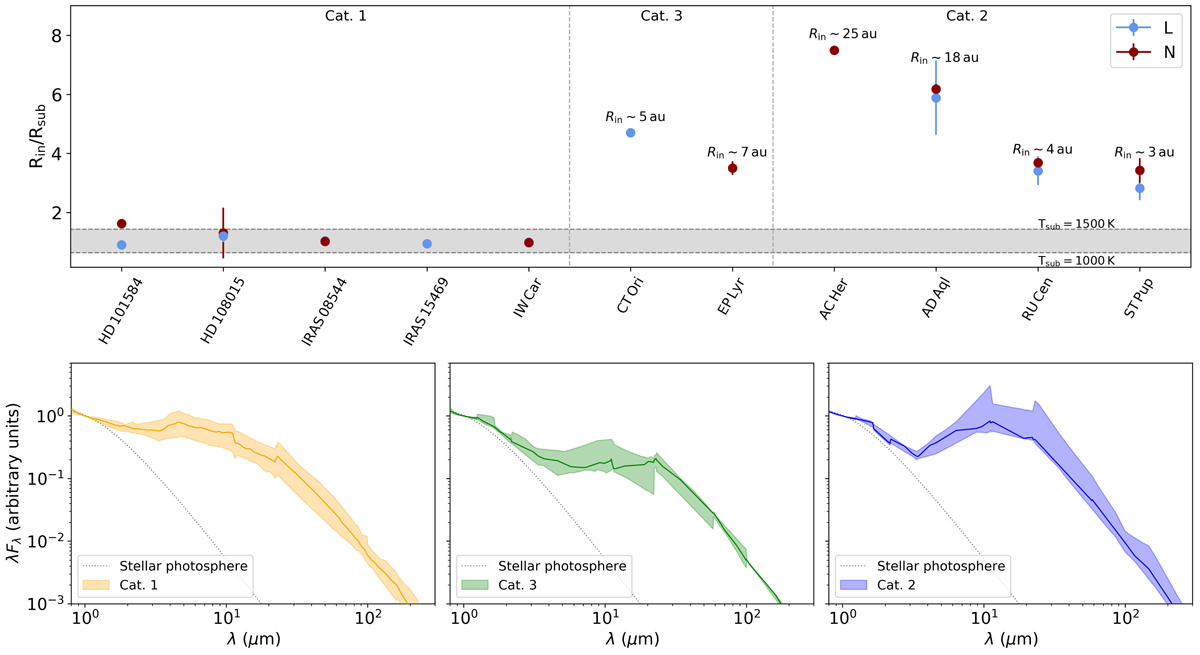
Fig. 2.
Download original image
Cavity size diagram for the 11 systems (top) and the corresponding median SEDs (bottom). The cavity sizes are displayed relative to the theoretical dust sublimation radii. The shaded grey area corresponds to the dust sublimation radii with temperatures of 1000–1500 K. The physical sizes of the inner rim radii are indicated for the transition discs assuming Gaia DR3 distances. The categories correspond to the classification of the SEDs by Kluska et al. (2022). The median SEDs of sources in categories 1, 3, and 2 are shown below and indicate the differences in the IR excesses between each category.
Current usage metrics show cumulative count of Article Views (full-text article views including HTML views, PDF and ePub downloads, according to the available data) and Abstracts Views on Vision4Press platform.
Data correspond to usage on the plateform after 2015. The current usage metrics is available 48-96 hours after online publication and is updated daily on week days.
Initial download of the metrics may take a while.