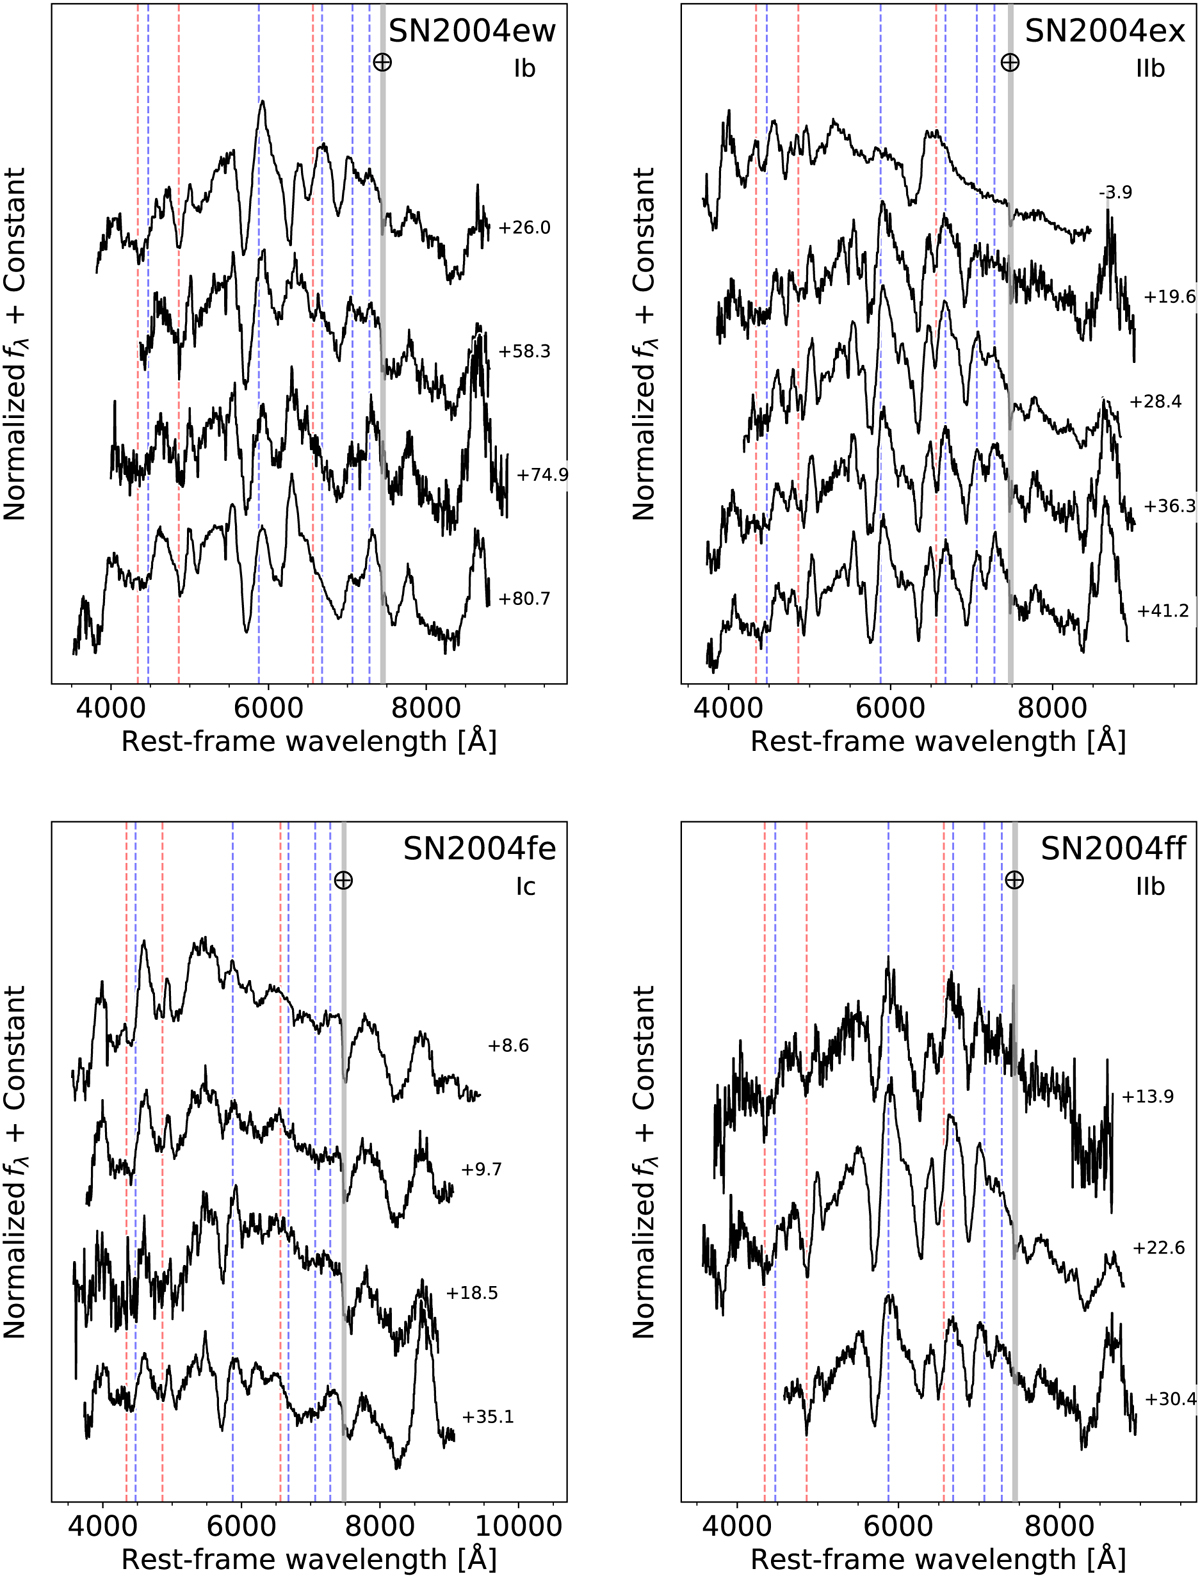
Fig. 2
Download original image
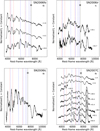
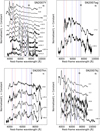
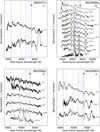
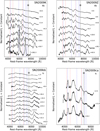
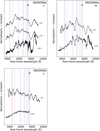
Optical spectroscopy of the CSP-I SE SN sample. Each spectrum has been normalized to its mean flux values and plotted in units of fλ. For presentation purposes additive constants have also been applied. The phase of each spectrum relative to the epoch of the B-band maximum is provided next to each spectrum and the spectroscopic subtype is provided below the SN designation at the top right. Vertical dashed blue lines indicate rest wavelengths of He I λλ4472, 5876, 6678, 7065, 7281 lines, vertical dashed red lines are Hγ, H β, and Hα, and the vertical gray line indicates the location of a prominent telluric feature.
Current usage metrics show cumulative count of Article Views (full-text article views including HTML views, PDF and ePub downloads, according to the available data) and Abstracts Views on Vision4Press platform.
Data correspond to usage on the plateform after 2015. The current usage metrics is available 48-96 hours after online publication and is updated daily on week days.
Initial download of the metrics may take a while.