Fig. 3
Download original image
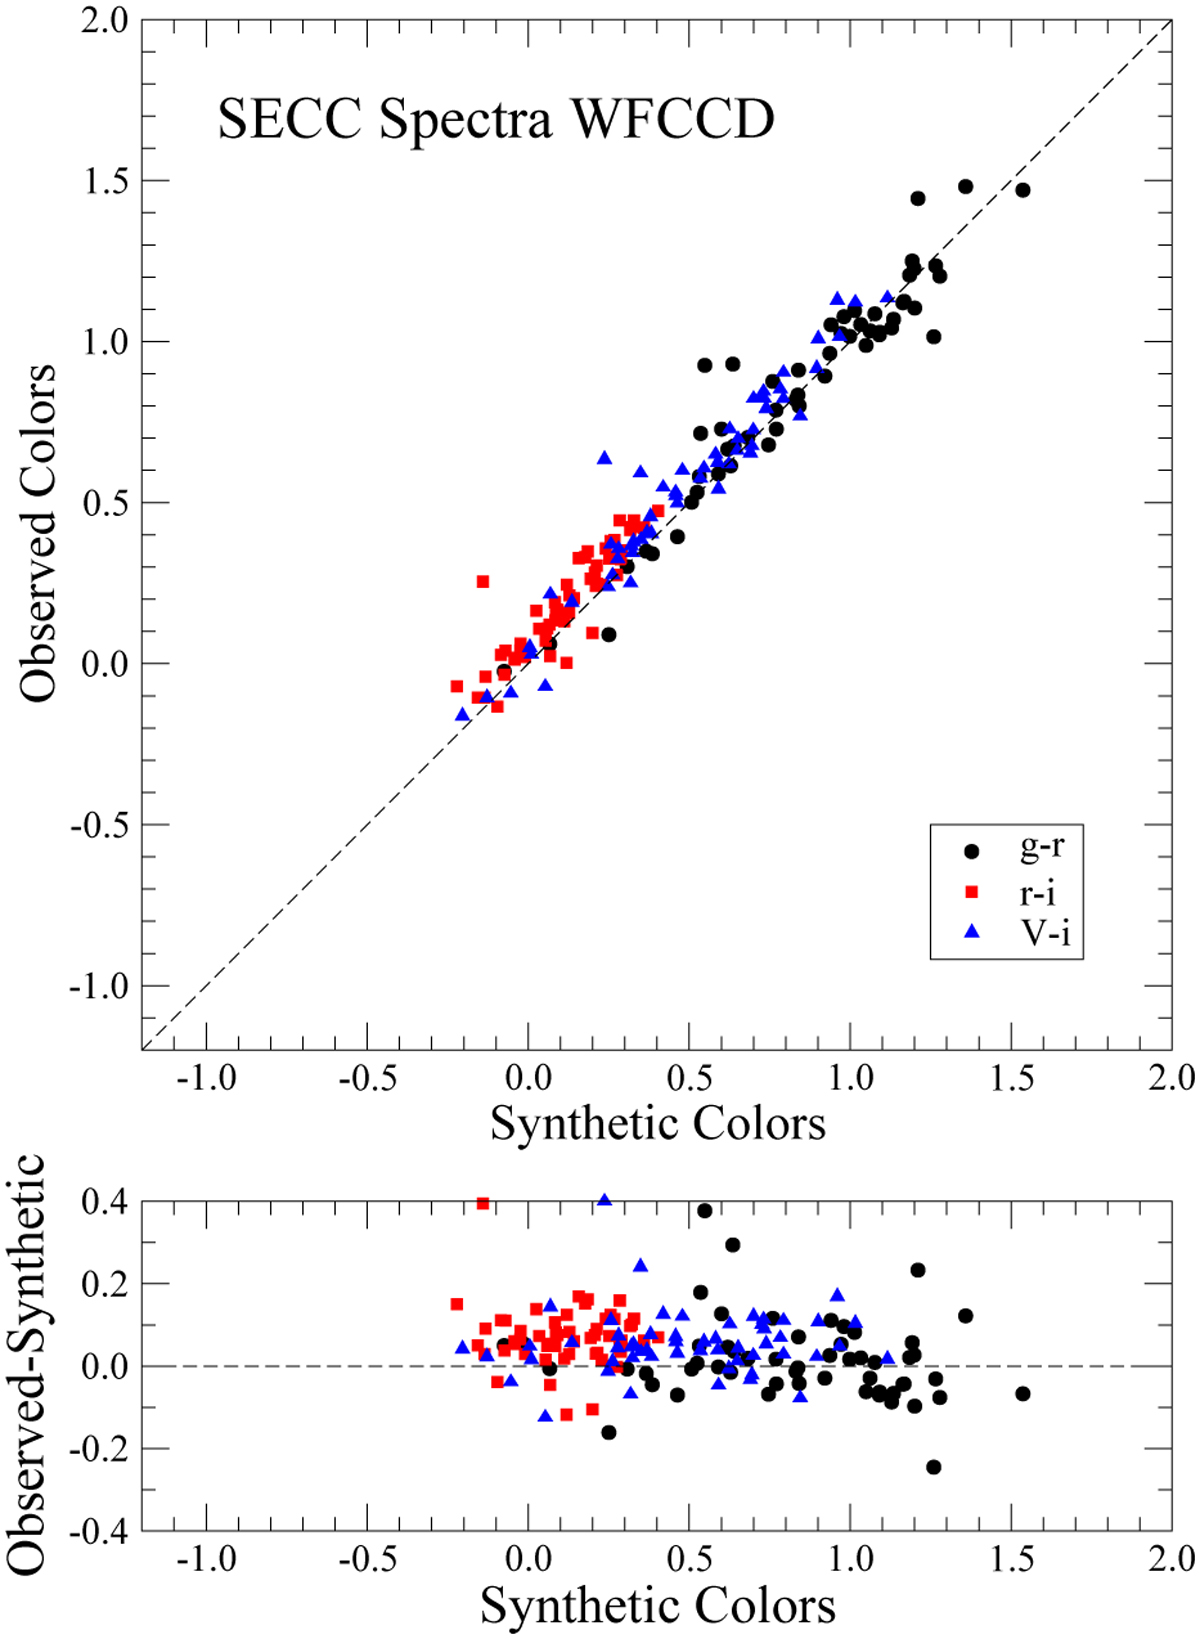
Quality of the spectral flux calibration. Top panel: comparison between observed and synthetic colors (ɡ – r) indicated with black dots, (r – i) with red squares, and (V – i) with blue triangles. Synthetic colors are computed using WFCCD spectra and the CSP-I system response functions (see Krisciunas et al. 2017, and references therein). Bottom panel: residual between the observed and synthetic colors vs. synthetic colors. The dashed line has a slope of unity.
Current usage metrics show cumulative count of Article Views (full-text article views including HTML views, PDF and ePub downloads, according to the available data) and Abstracts Views on Vision4Press platform.
Data correspond to usage on the plateform after 2015. The current usage metrics is available 48-96 hours after online publication and is updated daily on week days.
Initial download of the metrics may take a while.