Fig. 3.
Download original image
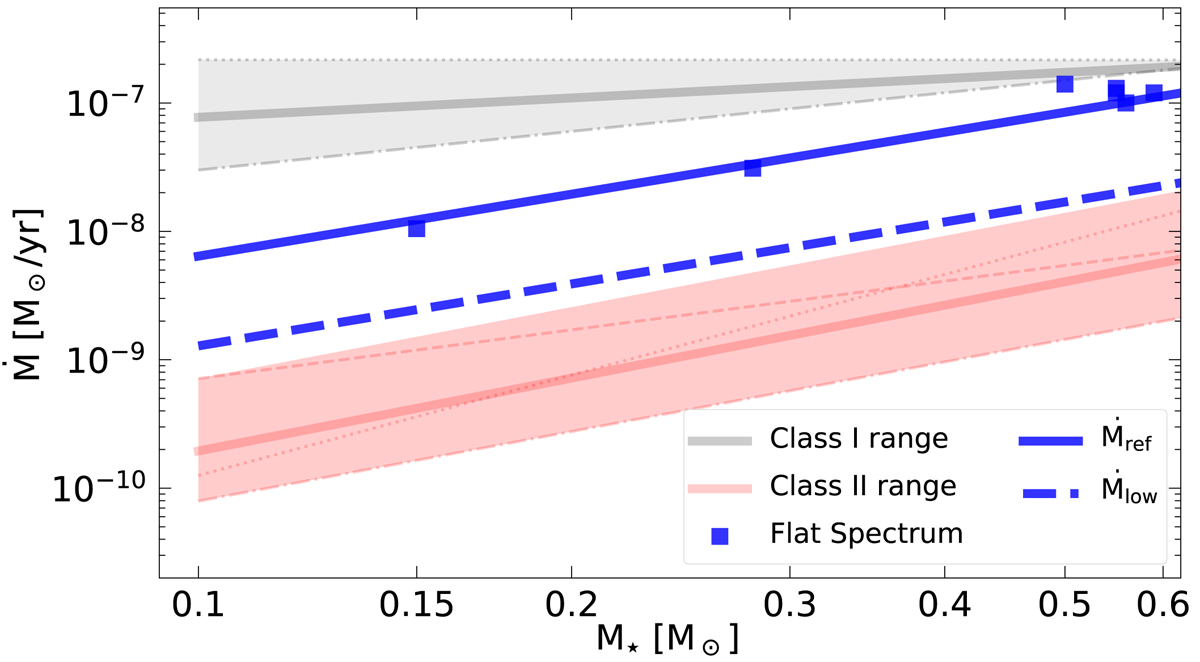
Observed accretion rates of Class I (gray), Class II (red), and flat spectrum (blue) sources. The gray dash-dotted line is taken from Fiorellino et al. (2021) and the gray dotted line from Caratti o Garatti et al. (2012). The gray-shaded area is limited by the two lines. The red dashed, dotted, and dash-dotted lines are taken from Manara et al. (2012), Fiorellino et al. (2021), and Testi et al. (2022), respectively. The red-shaded area has a minimum but constant logarithmic height so that all red lines are comprised. The thick gray and red lines indicate the mean values of the Class I and Class II objects. The blue squares represent accretion rates of flat spectrum sources (summarized in Table B.1). The blue line is the best fit for the flat spectrum objects and the dashed line is five times less than that, just above the Class II regime.
Current usage metrics show cumulative count of Article Views (full-text article views including HTML views, PDF and ePub downloads, according to the available data) and Abstracts Views on Vision4Press platform.
Data correspond to usage on the plateform after 2015. The current usage metrics is available 48-96 hours after online publication and is updated daily on week days.
Initial download of the metrics may take a while.