Fig. 1.

Download original image
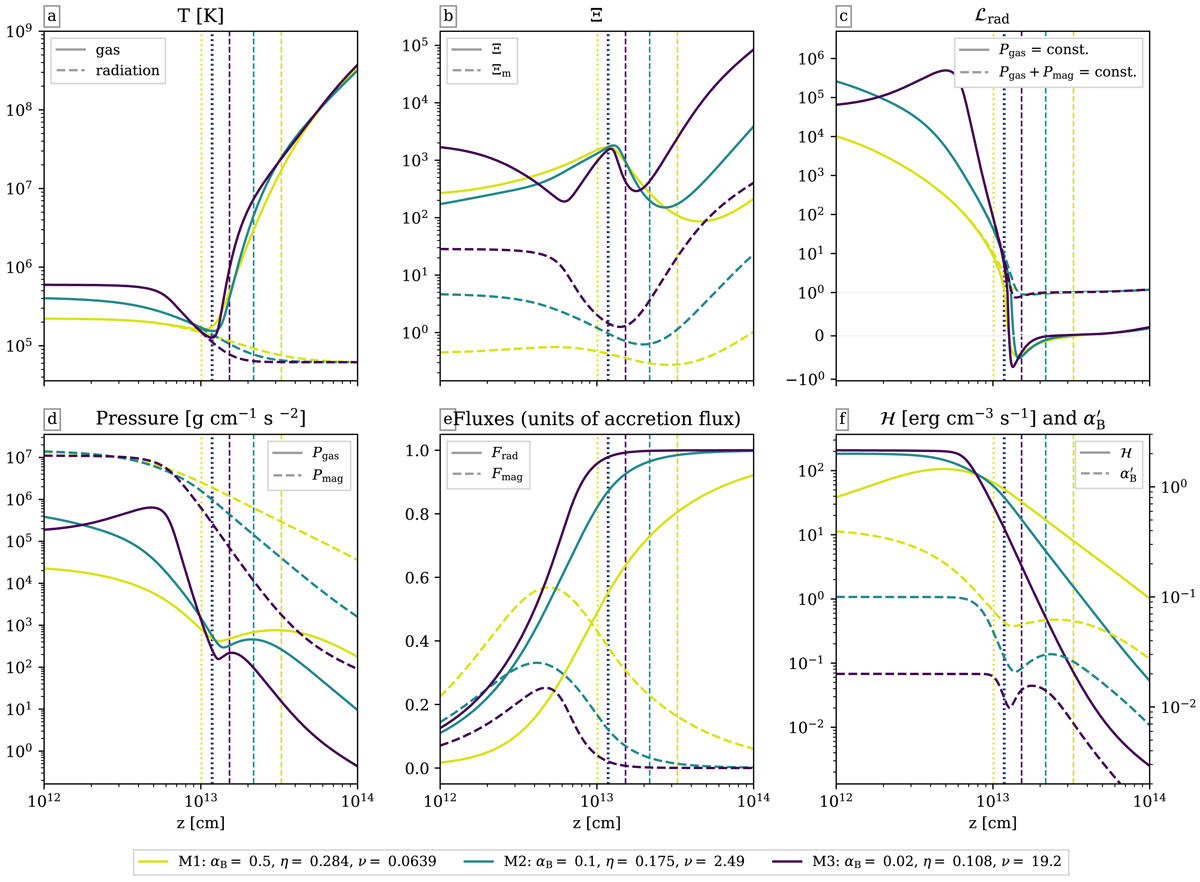
Vertical structure of an accretion disk for our CM model versus z in cm measured from disk mid-plane (z = 0) up to the surface (right side of the figure panels), and for three different sets of magnetic parameters ranging from the strongest (M1, as a yellow line) to the weakest (M3, as a black line) magnetic field, and listed in the box below the figure. The local temperature, ionization parameter (Eqs. (17) and (20)), and stability parameter (Eq. (18)) are plotted in the top row, while pressures, fluxes relative to the total dissipated flux, and heating rate are plotted in the bottom row, respectively. In addition, the value of ![]() according to Eq. (12) is shown in the last panel of second row, by dashed lines. The positions of corona base τcor are marked by vertical dotted lines, and the positions of photosphere are shown as dashed lines for each model, respectively.
according to Eq. (12) is shown in the last panel of second row, by dashed lines. The positions of corona base τcor are marked by vertical dotted lines, and the positions of photosphere are shown as dashed lines for each model, respectively.
Current usage metrics show cumulative count of Article Views (full-text article views including HTML views, PDF and ePub downloads, according to the available data) and Abstracts Views on Vision4Press platform.
Data correspond to usage on the plateform after 2015. The current usage metrics is available 48-96 hours after online publication and is updated daily on week days.
Initial download of the metrics may take a while.


