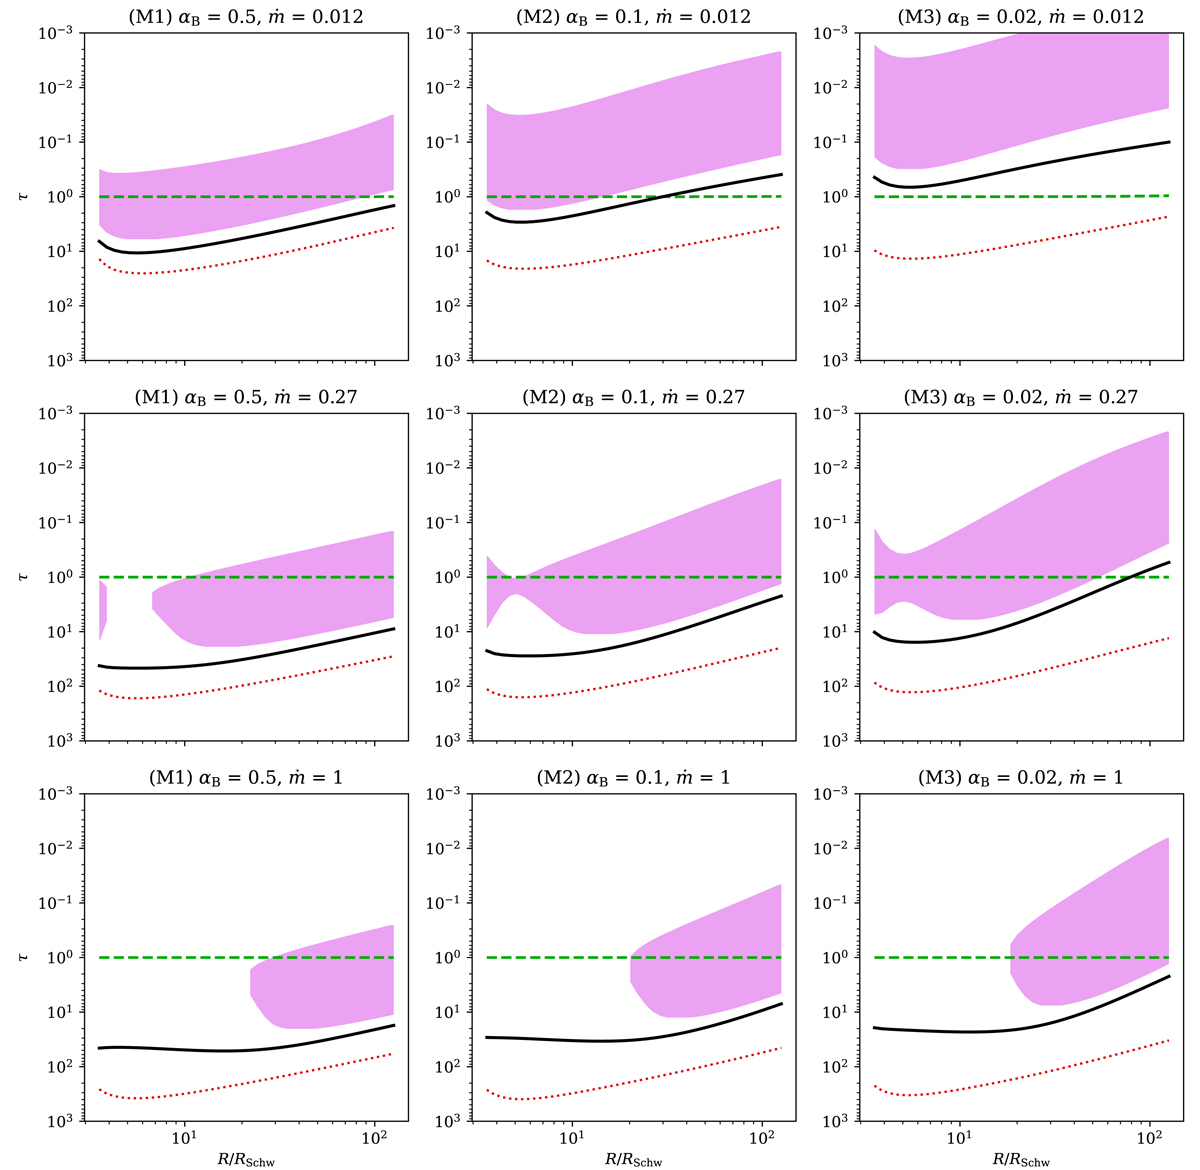
Fig. 5.
Download original image
Thomson scattering optical depth of TI zones, plotted against the radial distance from the BH of the mass MBH = 108 M⊙, and shown for three values of magnetic parameters M1, M2, and M3 (from left to right columns), and an accretion rate of ṁ = 0.012, 0.27, and 0.1 (from upper to bottom rows). The photosphere is marked using the green dashed line, temperature minimum with a thick black solid line, thermalization depth (τ * = 1) with a red dotted line. The extent of the thermal instability is presented as a pink-filled area.
Current usage metrics show cumulative count of Article Views (full-text article views including HTML views, PDF and ePub downloads, according to the available data) and Abstracts Views on Vision4Press platform.
Data correspond to usage on the plateform after 2015. The current usage metrics is available 48-96 hours after online publication and is updated daily on week days.
Initial download of the metrics may take a while.